

Question: I need help with question 3 but the information needed for 3 is in question 1 and 2. 3. Comparing Distributions: Use your answers from
- I need help with question 3 but the information needed for 3 is in question 1 and 2.
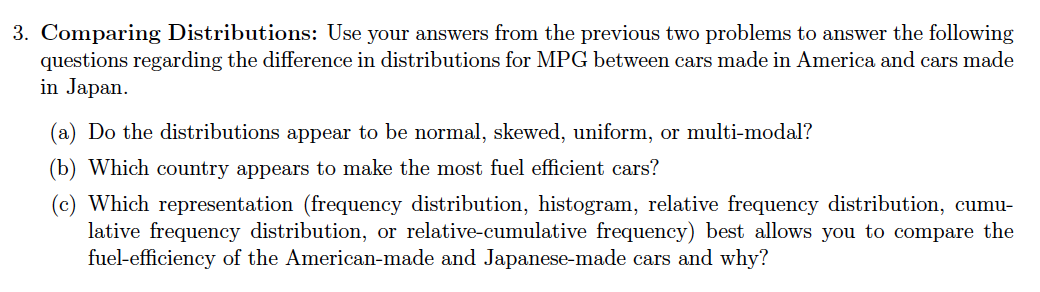
3. Comparing Distributions: Use your answers from the previous two problems to answer the following questions regarding the difference in distributions for MPG between cars made in America and cars made in Japan. (a) Do the distributions appear to be normal, skewed, uniform, or multi-modal? (b) Which country appears to make the most fuel efficient cars? (c) Which representation (frequency distribution, histogram, relative frequency distribution, cumu- lative frequency distribution, or relative-cumulative frequency) best allows you to compare the fuel-efficiency of the American-made and Japanese-made cars and why?Frequency Distributions and Histograms l- 85 -| 1f
Step by Step Solution
There are 3 Steps involved in it

Get step-by-step solutions from verified subject matter experts