

Question: statistic answer b and c 3. Comparing Distributions: Use your answers from the previous two problems to answer the following questions regarding the difference in
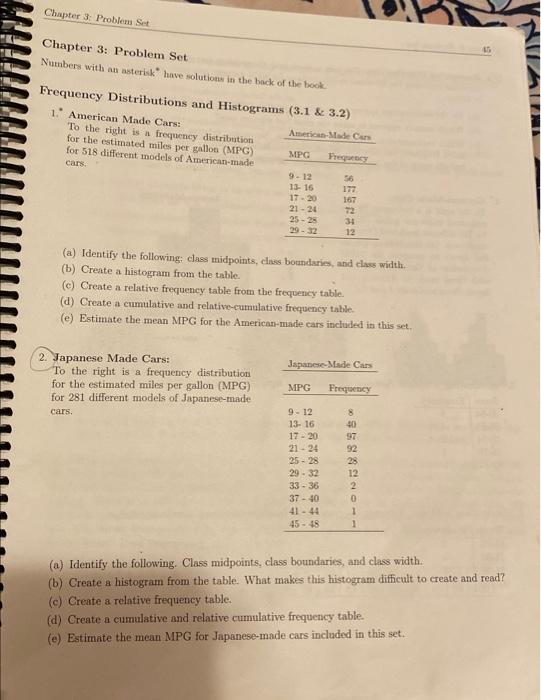
3. Comparing Distributions: Use your answers from the previous two problems to answer the following questions regarding the difference in distributions for MPG between cars made in America and cars made in Japan. (a) Do the distributions appear to be normal, skewed, uniform, or multi-modal? (b) Which country appears to make the most fuel efficient cars? (c) Which representation (frequency distribution, histogram, relative frequency distribution, cumulative frequency distribution, or relative-cumulative frequency) best allows you to compare the fuel-efficiency of the American-made and Japanese-made cars and why? Frequency Distributions and Histograms (3.1 \& 3.2 ) 1. American Made Cars: To the right is a frequency distribution for the estimated miles per gallon (MPG) for 518 different models of American-made cars. (a) Identify the following; class midpoints, class botndaries, and ches width. (b) Create a histogram from the table. (c) Create a relative frequency table from the frequency table. (d) Create a cumulative and relative-cumulative frequency table. (e) Estimate the mean MPG for the American-made cars included in this set. 2. Japanese Made Cars: To the right is a frequency distribution for the estimated miles per gallon (MPG) for 281 different models of Japanese-made cars. (a) Identify the following. Class midpoints, class boundaries, and class width. (b) Create a histogram from the table. What makes this histogram difficult to create and read? (c) Create a relative frequency table. (d) Create a cumulative and relative cumulative frequency table. (e) Estimate the mean MPG for Japanese-made cars included in this set
Step by Step Solution
There are 3 Steps involved in it

Get step-by-step solutions from verified subject matter experts