

Question: *I need help with the 2nd part, as you can see part 1 is answered. I need the answer in the format of the table
*I need help with the 2nd part, as you can see part 1 is answered. I need the answer in the format of the table above. Thanks!)
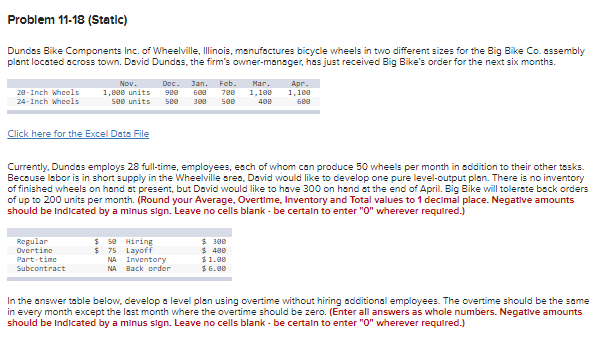
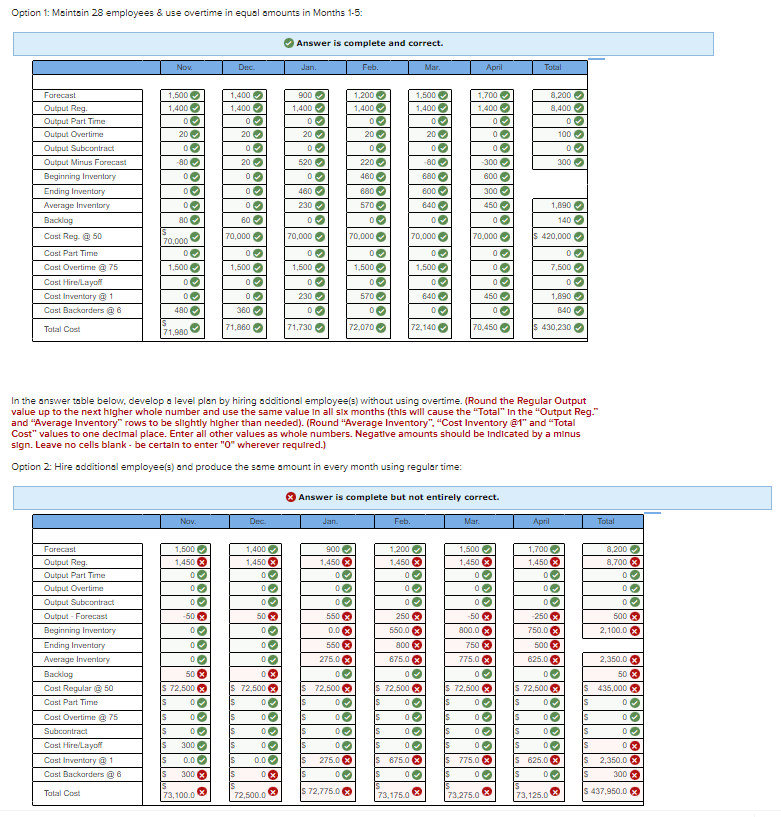
Problem 11-18 (Static) Dundas Bike Components Inc. of Wheelville, Illinois, manufactures bicycle wheels in two different sizes for the Big Bike Co. assembly plant located across town. David Dundas, the firm's owner-manager, has just received Big Bike's order for the next six months. 28-Inch Wheels 24-Inch Wheels Nov. 1,000 units 500 units Click here for the Excel Data File Regular Overtine Part-time Subcontract Dec. Jan. Feb. Mar. 988 608 788 1,100 580 308 500 408 Currently, Dundas employs 28 full-time, employees, each of whom can produce 50 wheels per month in addition to their other tasks. Because labor is in short supply in the Wheelville area, David would like to develop one pure level-output plan. There is no inventory of finished wheels on hand at present, but David would like to have 300 on hand at the end of April. Big Bike will tolerate back orders of up to 200 units per month. (Round your Average, Overtime, Inventory and Total values to 1 decimal place. Negative amounts should be Indicated by a minus sign. Leave no cells blank - be certain to enter "0" wherever required.) $ 50 Hiring $75 Layoff NA Inventory NA Back order Apr. 1,100 688 $ 300 $ 480 $1.00 $6.00 In the answer table below, develop a level plan using overtime without hiring additional employees. The overtime should be the same in every month except the last month where the overtime should be zero. (Enter all answers as whole numbers. Negative amounts should be indicated by a minus sign. Leave no cells blank - be certain to enter "0" wherever required.) Option 1: Maintain 28 employees & use overtime in equal amounts in Months 1-5: Forecast Output Reg. Output Part Time Output Overtime Output Subcontract Output Minus Forecast Beginning Inventory Ending Inventory Average Inventory Backlog Cost Reg. @ 50 Cost Part Time Cast Overtime @ 75 Cost Hire/Layoff Cost Inventory @ 1 Cost Backorders @ 6 Total Cost Forecast Output Reg. Output Part Time Output Overtime Output Subcontract Output - Forecast Beginning Inventory Ending Inventory Average Inventory Backlog Cost Regular @ 50 Cost Part Time Cost Overtime @ 75 Subcontract Cost Hire/Layoff Cast Inventory @ 1 Cost Backorders@6 Total Cost Nov. 1,500 1,400 0 20 0 -80 00 70,000 0 1,500 S S S 0 0 80 S S 71,980 0 00 480 Nav 1,500 1,450 x 00 $ 72,500 0 -50x 00 0 0 50 X 0 0 00 300 0.0 300 X 73,100.0 1,400 1,400 Dec. 70,000 0 20 0 20 0 0 0 60 0 1,500 0 0 360 71,860 S S $ $ S Dec. 1,400 1,450x 0 0 50 X 00 $ 72,500 0 0 00 00 00 0X 0.0 0x Answer is complete and correct. 72,500.0 Jan. 900 1,400 0 20 0 520 0 460 230 0 70,000 0 1,500 0 230 0 71,730 Jan. Feb. 1,200 1,400 220 460 680 570 0 70,000 0 0 20 0 900 1,450 x 0 0 0 550x 0.0 x 550x 275.0* 0 $ 72,500x S 0 $ 0 $ 00 S 00 S 275.0 x S 0 $ 72,775.0 x 1,500 0 In the answer table below, develop a level plan by hiring additional employee(s) without using overtime. (Round the Regular Output value up to the next higher whole number and use the same value in all six months (this will cause the "Total" In the "Output Reg." and "Average Inventory" rows to be slightly higher than needed). (Round "Average Inventory". "Cost Inventory @1" and "Total Cost" values to one decimal place. Enter all other values as whole numbers. Negative amounts should be indicated by a minus sign. Leave no cells blank - be certain to enter "0" wherever required.) Option 2: Hire additional employee(s) and produce the same amount in every month using regular time: 570 72,070 00 Feb. 1,500 1,400 Mar. 73,175.0 0 20 00 -80 680 70,000 0 1,500 800 x 675.0 x 0 600 640 0 640 0 72,140 1,200 1,450 x 0 00 0 250 X 550.0 X 72,500 0 S 0 $ 00 $ 0 S 675.0 x 0 1,700 1,400 Answer is complete but not entirely correct. April 0 00 00 -300 600 300 450 0 70,000 Mar. 0 70,450 450 1,500 1,450 x 0 00 0 -50 x 800.0 750 x 775.0 0 72,500x S S S S 775.0 0 73,275.0 333 0 0 0 0 0 0 0 Total S S S 8,200 8,400 1,890 140 $ 420,000 0 100 0 300 0 7,500 0 1,890 840 S 430,230 April 1,700 1,450 x 0 00 0 -250x 750.0x 500 x 625.0 0 $ 72,500 S 0 0 0 $ 625.0 x 0 S S 73,125.0 S S S Total IS 8,200 8,700 x 0 0 0 500 x 2,100.0 x 50 x IS 435,000x S 0 0 0 0x 2,350.0 2,350.0 300 x S S 437,950.0Step by Step Solution
There are 3 Steps involved in it
1 Expert Approved Answer
Step: 1 Unlock

Question Has Been Solved by an Expert!
Get step-by-step solutions from verified subject matter experts
Step: 2 Unlock
Step: 3 Unlock