

Question: I need help with this assignment. This assignment requires the use of SOLVER in EXCEL , so if you do not have the program, S
I need help with this assignment. This assignment requires the use of SOLVER in EXCEL, so if you do not have the program, Solver, please allow another who does to help out.
These are the requirements:
1) Provide the background of the problem you are attempting to resolve.
2) Create a mathematical equation for the problem on the first tab of your Excel Worksheet
3) Solve the problem using Solver (linear programming) on the second tab of your Excel Worksheet.
4) Provide a management report (discuss results, sensitivity analysis, and provide recommendations) for your findings in a Word Document. Students should use screen shots to insert both the Solver solution and the sensitivity analysis in the management report completed in Word.
THIS is the case problem the above requirements apply to:
Make sure that everything submitted is done in a clear and easy to read manner. Also, lay everything out, especially FORMULAS, so I can see both the results and the "show your work" part. Lastly, make sure ALL requirements are read and fulfilled.
If you have any questions, please comment and let me know.
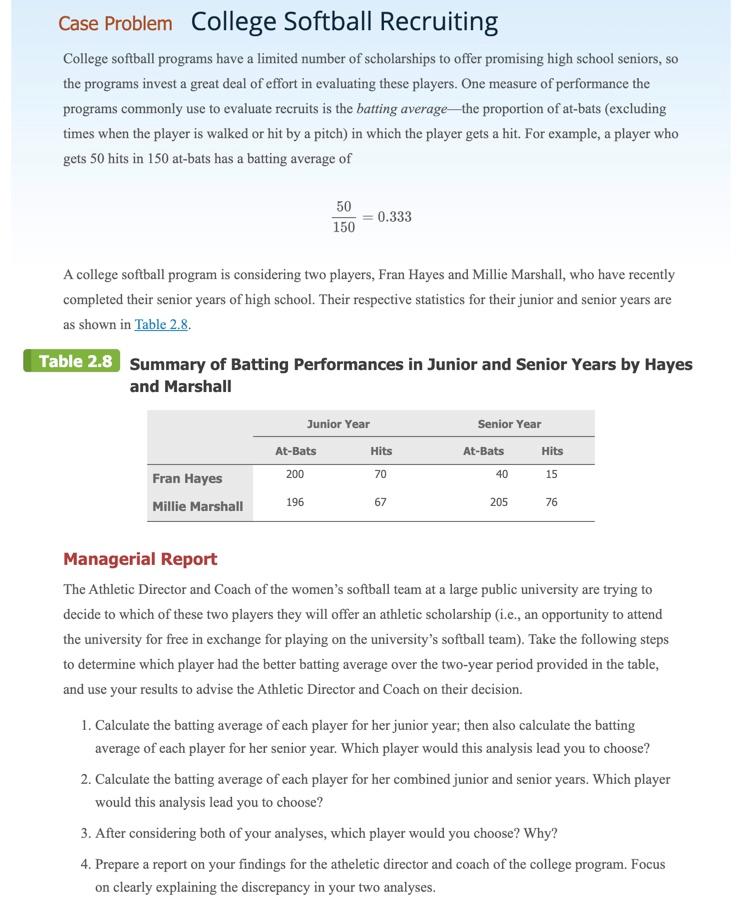
Case Problem College Softball Recruiting College softball programs have a limited number of scholarships to offer promising high school seniors, so the programs invest a great deal of effort in evaluating these players. One measure of performance the programs commonly use to evaluate recruits is the batting average the proportion of at-bats (excluding times when the player is walked or hit by a pitch) in which the player gets a hit. For example, a player who gets 50 hits in 150 at-bats has a batting average of 50 150 0.333 A college softball program is considering two players, Fran Hayes and Millie Marshall, who have recently completed their senior years of high school. Their respective statistics for their junior and senior years are as shown in Table 2.8. Table 2.8 Summary of Batting Performances in Junior and Senior Years by Hayes and Marshall Senior Year Junior Year At-Bats Hits At-Bats Hits 200 70 40 15 Fran Hayes Millie Marshall 196 67 205 76 Managerial Report The Athletic Director and Coach of the women's softball team at a large public university are trying to decide to which of these two players they will offer an athletic scholarship (i.e., an opportunity to attend the university for free in exchange for playing on the university's softball team). Take the following steps to determine which player had the better batting average over the two-year period provided in the table, and use your results to advise the Athletic Director and Coach on their decision. 1. Calculate the batting average of each player for her junior year, then also calculate the batting average of each player for her senior year. Which player would this analysis lead you to choose? 2. Calculate the batting average of each player for her combined junior and senior years. Which player would this analysis lead you to choose? 3. After considering both of your analyses, which player would you choose? Why? 4. Prepare a report on your findings for the atheletic director and coach of the college program. Focus on clearly explaining the discrepancy in your two analyses. Case Problem College Softball Recruiting College softball programs have a limited number of scholarships to offer promising high school seniors, so the programs invest a great deal of effort in evaluating these players. One measure of performance the programs commonly use to evaluate recruits is the batting average the proportion of at-bats (excluding times when the player is walked or hit by a pitch) in which the player gets a hit. For example, a player who gets 50 hits in 150 at-bats has a batting average of 50 150 0.333 A college softball program is considering two players, Fran Hayes and Millie Marshall, who have recently completed their senior years of high school. Their respective statistics for their junior and senior years are as shown in Table 2.8. Table 2.8 Summary of Batting Performances in Junior and Senior Years by Hayes and Marshall Senior Year Junior Year At-Bats Hits At-Bats Hits 200 70 40 15 Fran Hayes Millie Marshall 196 67 205 76 Managerial Report The Athletic Director and Coach of the women's softball team at a large public university are trying to decide to which of these two players they will offer an athletic scholarship (i.e., an opportunity to attend the university for free in exchange for playing on the university's softball team). Take the following steps to determine which player had the better batting average over the two-year period provided in the table, and use your results to advise the Athletic Director and Coach on their decision. 1. Calculate the batting average of each player for her junior year, then also calculate the batting average of each player for her senior year. Which player would this analysis lead you to choose? 2. Calculate the batting average of each player for her combined junior and senior years. Which player would this analysis lead you to choose? 3. After considering both of your analyses, which player would you choose? Why? 4. Prepare a report on your findings for the atheletic director and coach of the college program. Focus on clearly explaining the discrepancy in your two analyses.Step by Step Solution
There are 3 Steps involved in it

Get step-by-step solutions from verified subject matter experts