

Question: I need help with this practice worksheet. (The information is placed in the white boxes, use the existing information the gray boxes do not have
I need help with this practice worksheet. (The information is placed in the white boxes, use the existing information the gray boxes do not have any information) I have already completed this but wanted to see if my answers match up with that of a tutor.
Instructions:Fill out the white boxes in the chart below using these calculation instructions.
First, note that some of the states did not report census figures for slaves or total population in a year, so you will not be able to do the calculations in grayed out boxes. Please complete the calculations in the white boxes. In the first column of white boxes (1790) and the second column (1820), you will make the same calculation: the percentage of the state's population that was slave. Let us take Connecticut as an example.
In 1790 in Connecticut, there were 2,764 slaves out of a total population of 237,946. To determine the percentage of slaves, divide the slave population by the total population using this formula. You will note that the slave population was very small at 1.16%.
2,764 237,946 = .0116 100 = 1.16%
Do the same formula for 1820 in Connecticut. While the total population of Connecticut grew in 30 years, the slave population reduced dramatically to .008% of the total.
25 297,675 = .00000839 100 = .008%
Now we are going to calculate the percent change in column 3, which will tell us how much Connecticut's slave population shrank in 30 years. We will be using only the slave figures to make this calculation. Take Connecticut's slave population in 1820 (25) and subtract it from the slave population in 1790 (2,764), and you will get a negative number of -2,739. Then you will divide the negative number by the population of slaves in 1790, which gets you the negative figure of -.99, which you multiply by 100 to get a negative percentage of -99%. The percent change of -99% indicates not only that slavery in Connecticut declined over 30 years but that it plummeted and was close to disappearing.
25 - 2,764 = -2,739 2,764 = -.99 100 = -99%
Finally, in the last row make the same three calculations on the US population.
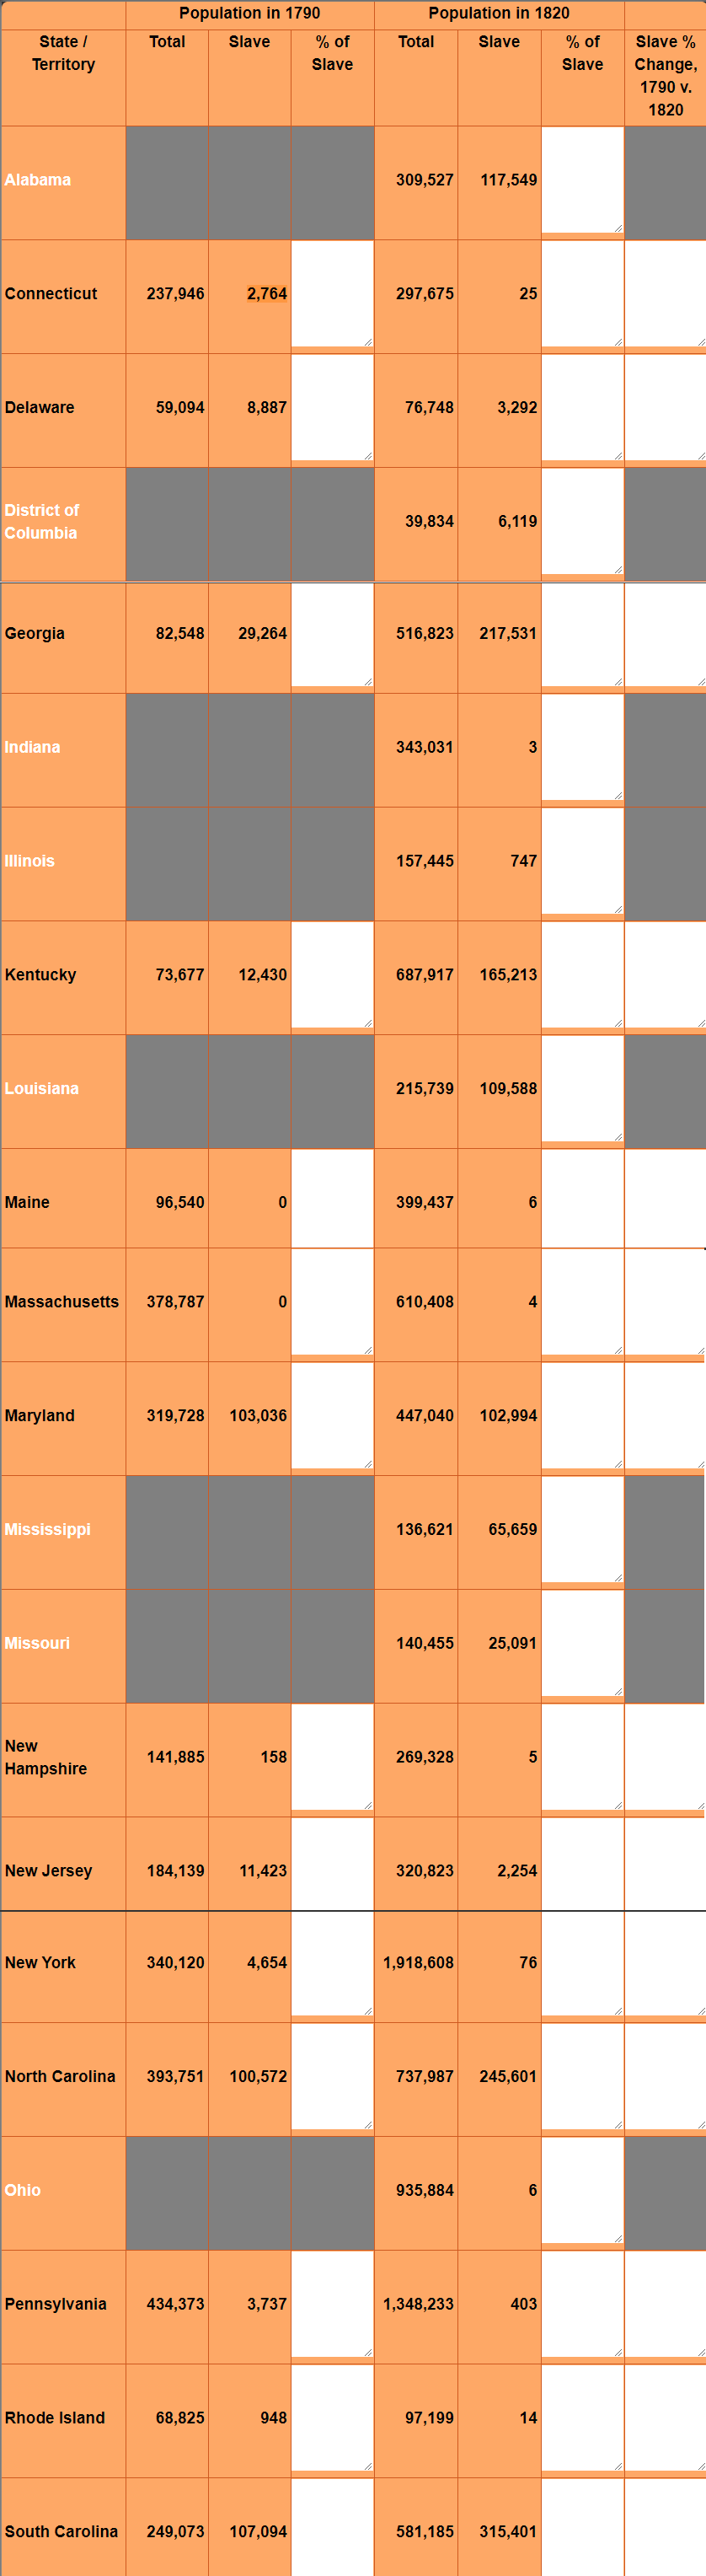
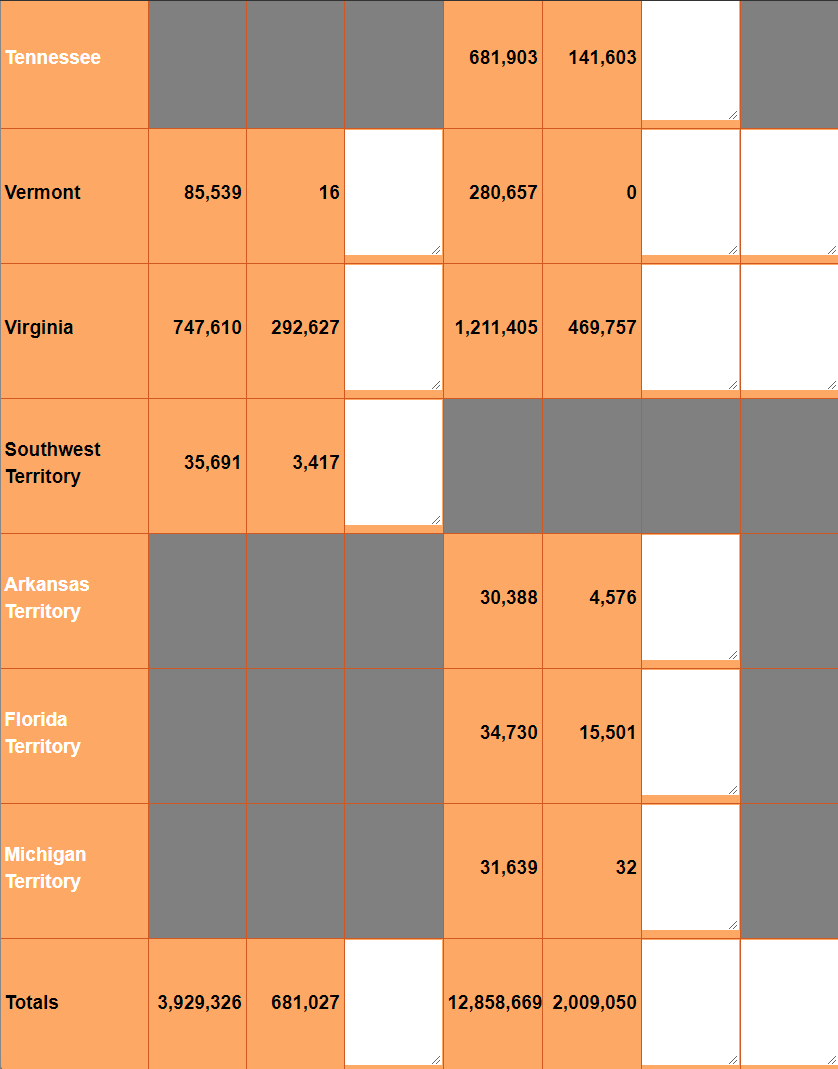
Population in 1790 Population in 1820 State / Total Slave % of Total Slave % of Slave % Territory Slave Slave Change, 1790 v 1820 Alabama 309,527 117,549 Connecticut 237,946 2,764 297,675 25 Delaware 59,094 8,887 76,748 3,292 District of Columbia 39,834 6,119 Georgia 82,548 29,264 516,823 217,531 Indiana 343,031 3 Illinois 157,445 747 Kentucky 73,677 12,430 687,917 165,213 Louisiana 215,739 109,588 Maine 96,540 399,437 6 Massachusetts 378,787 610,408 Maryland 319,728 103,036 447,040 102,994 Mississippi 136,621 65,659 Missouri 140,455 25,091 New 141,885 158 Hampshire 269,328 5 New Jersey 184,139 11,423 320,823 2,254 New York 340, 120 4,654 1,918,608 76 North Carolina 393,751 100,572 737,987 245,601 Ohio 935,884 6 Pennsylvania 434,373 3,737 1,348,233 403 Rhode Island 68,825 948 97, 199 14 South Carolina 249,073 107,094 581,185 315,401\f
Step by Step Solution
There are 3 Steps involved in it

Get step-by-step solutions from verified subject matter experts