

Question: I need help woth this question, need to submit by tonight! pleasee help this is all there is! hope this helps, I need the questions
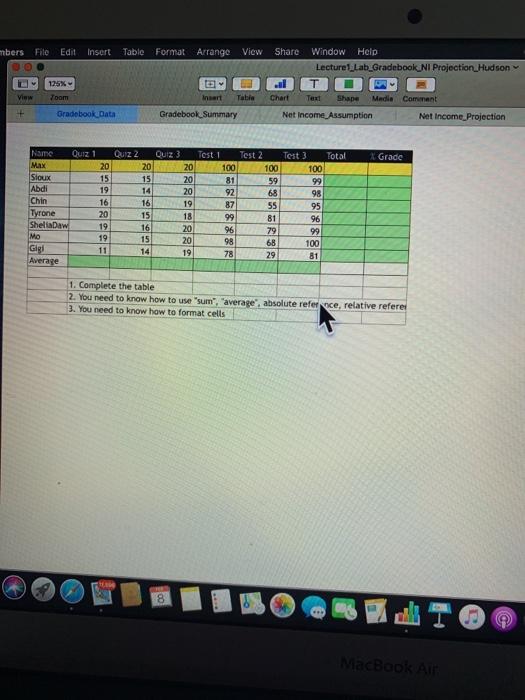
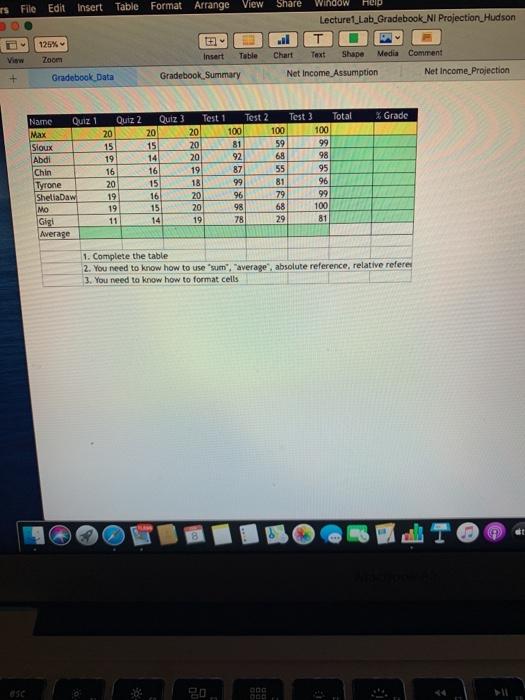
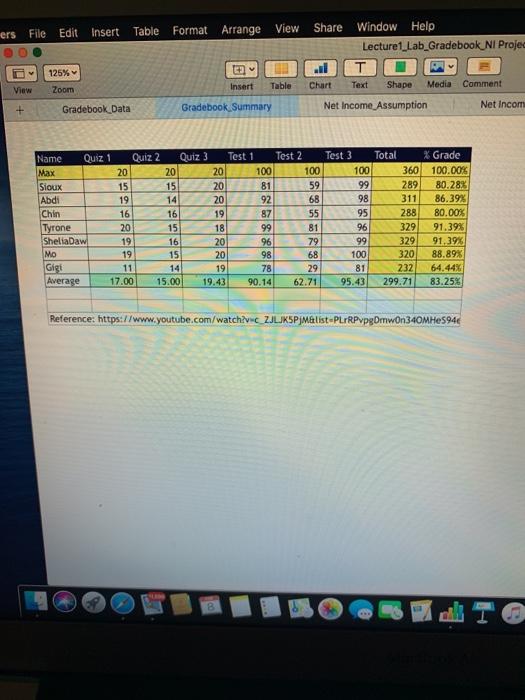
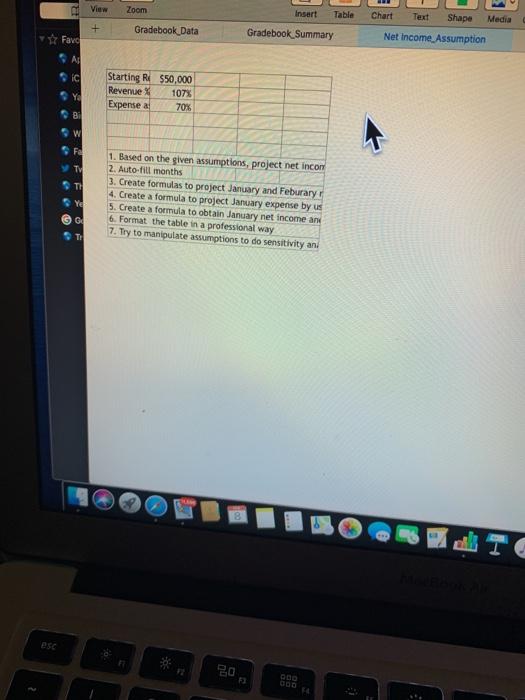
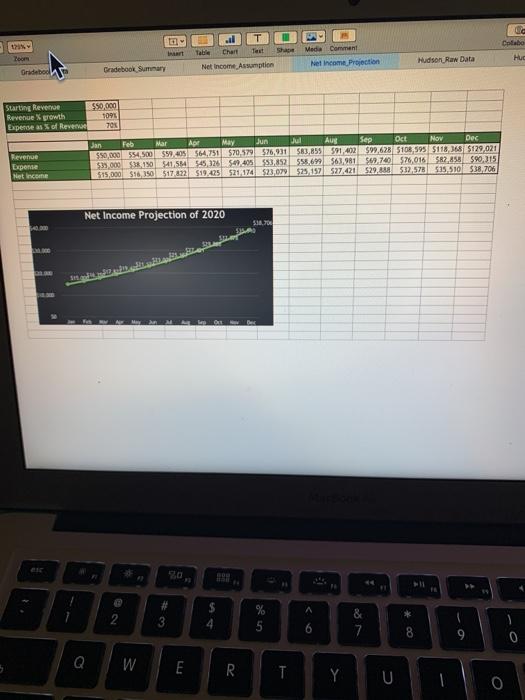
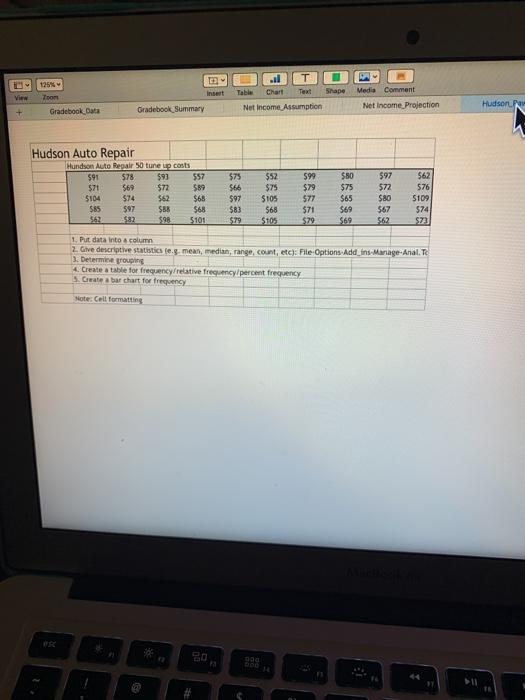
mbers File Edit Insert 125% Toom Table Format Arrange View Share Window Help Lecturel Lab Gradebook NI Projection Hudson T Insert Tabia Chart Shape Media Comment Gradebook Summary Net Income Assumption Net Income Projection View Gradebook Data Total Grade Name Quiz 1 Max 20 Sioux 15 Abdi 19 Chin 16 Tyrone 20 Shell Daw 19 MO 19 Gigi 11 Average Quiz 2 Quiz 3 Testi Test 2 2020 100 100 15 20 81 59 14 20 92 68 16 19 87 55 15 18 99 81 16 20 96 79 15 20 98 68 14 19 78 29 Test 3 100 99 98 95 96 100 81 1. Complete the table 2. You need to know how to use "sum","average, absolute referace, relative refere 3. You need to know how to format cells 8 MacBook Air Insert S File Edit Share Table Format Arrange View Window Help Lecture 1 Lab_Gradebook_NI Projection Hudson T Text Shape Media Comment 125% Zoom Insert Table Chart + Gradebook Data Gradebook. Summary Net Income Projection Net Income Assumption Total Grade Name Quiz 1 Max Sioux Abdi Chin Tyrone Sheliabaw Mo Gigi Average Quiz 2 Quiz 3 20 20 15 15 19 14 16 16 20 15 19 16 19 15 11 14 Test 1 Test 2 Test 3 20 100 100 100 20 81 59 99 20 92 68 98 19 87 55 95 18 99 81 96 20 96 79 99 20 98 68 100 19 78 29 81 1. Complete the table 2. You need to know how to use sum","average", absolute reference, relative referer 3. You need to know how to format cells ers File Edit Insert Table Format Arrange View ED 125% Zoom Share Window Help Lecture 1_lab_Gradebook_NI Projec T Chart Text Shape Media Comment Net Income Assumption Net Incom View Insert Table + Gradebook Data Gradebook Summary Name Quiz 1 Quiz 2 Quiz 3 Test 1 Test 2 Max 20 20 20 100 100 Sioux 15 15 20 81 59 Abdi 19 14 20 92 68 Chin 16 16 19 87 55 Tyrone 20 15 18 99 81 SheliaDaw 19 16 20 96 79 MO 19 15 20 98 68 Gigi 11 14 19 78 29 Average 17.00 15.00 19.43 90.14 62.71 Test 3 Total 100 360 99 289 98 311 95 288 96 329 99 329 100 320 81 232 95.43 299.71 * Grade 100.00% 80.28% 86.39% 80.00% 91.39% 91.39% 88.89% 64.44% 83.25% Reference: https://www.youtube.com/watch?vc ZJLJKSP Malist=PLrRPvpgDrwon340MHE594 View Zoom Insert Table Chart Text Shape Media + Gradebook Data Gradebook Summary Net Income Assumption Favo A IC Y Starting B, 90,000 Revenue 107% Expense a 70% w F TI Yd 1. Based on the given assumptions, project net incon 2. Auto-fill months 3. Create formulas to project January and Feburary 4. Create a formula to project January expense by us 5. Create a formula to obtain January net income any 6. Format the table in a professional way 7. Try to manipulate assumptions to do sensitivity ani GO 20 Colabo . T Chart Text Net Income Assumption Hudson Raw Data Media Comment Net Income Projection Zoon Gradeboe Hud Gradebook Summary Starting Revenue $50,000 Revenue growth 10 Expenses of Reverso 70% Revenue Expense Net Income Jan Feb Mar Apr May Jun Aug Sep Oct Dec $50,000 554,500 59.405564.71 $70579576,031 583,899 591,402509,628 5108,595 $118,368 $129,021 $33,000 $38,150 $41.54545,326549.405 553,852 555.699562,981 $69.700 576,016 $82,858 590,115 515,000 $16150517 822519.425521174523,079 $25,157527021529.512.578 525,510 538,706 Net Income Projection of 2020 $11.70 200 0 A 2 3 4 5 6 & 7 8 8 0 Q 3 E R T Y 0 ul T Insert Table Chant Text Shape View Media Comment Net Income Projection Gradebook Data Hudsonly Gradebook Summary Net Income Assumption Hudson Auto Repair 557 $52 $50 Hundson Auto Repair 50 tune up costs $91 578 $93 571 569 $72 589 5104 $74 $62 $65 $85 $97 $38 $68 562 598 5101 $75 $66 $97 583 $75 $105 $68 $105 599 $79 577 $71 $70 $75 $65 569 569 $97 $72 $80 567 562 562 576 S109 574 7 1. Put data into a column 2. Give descriptive statistics (eg, mean, median, range, count, etc): File-Options Add ins Manage Anal.Te 3. Determine grouping 4. Create a table for frequency relative frequency/percent frequency 5. Cate a bar chart for frequency Note: Call formatting mbers File Edit Insert 125% Toom Table Format Arrange View Share Window Help Lecturel Lab Gradebook NI Projection Hudson T Insert Tabia Chart Shape Media Comment Gradebook Summary Net Income Assumption Net Income Projection View Gradebook Data Total Grade Name Quiz 1 Max 20 Sioux 15 Abdi 19 Chin 16 Tyrone 20 Shell Daw 19 MO 19 Gigi 11 Average Quiz 2 Quiz 3 Testi Test 2 2020 100 100 15 20 81 59 14 20 92 68 16 19 87 55 15 18 99 81 16 20 96 79 15 20 98 68 14 19 78 29 Test 3 100 99 98 95 96 100 81 1. Complete the table 2. You need to know how to use "sum","average, absolute referace, relative refere 3. You need to know how to format cells 8 MacBook Air Insert S File Edit Share Table Format Arrange View Window Help Lecture 1 Lab_Gradebook_NI Projection Hudson T Text Shape Media Comment 125% Zoom Insert Table Chart + Gradebook Data Gradebook. Summary Net Income Projection Net Income Assumption Total Grade Name Quiz 1 Max Sioux Abdi Chin Tyrone Sheliabaw Mo Gigi Average Quiz 2 Quiz 3 20 20 15 15 19 14 16 16 20 15 19 16 19 15 11 14 Test 1 Test 2 Test 3 20 100 100 100 20 81 59 99 20 92 68 98 19 87 55 95 18 99 81 96 20 96 79 99 20 98 68 100 19 78 29 81 1. Complete the table 2. You need to know how to use sum","average", absolute reference, relative referer 3. You need to know how to format cells ers File Edit Insert Table Format Arrange View ED 125% Zoom Share Window Help Lecture 1_lab_Gradebook_NI Projec T Chart Text Shape Media Comment Net Income Assumption Net Incom View Insert Table + Gradebook Data Gradebook Summary Name Quiz 1 Quiz 2 Quiz 3 Test 1 Test 2 Max 20 20 20 100 100 Sioux 15 15 20 81 59 Abdi 19 14 20 92 68 Chin 16 16 19 87 55 Tyrone 20 15 18 99 81 SheliaDaw 19 16 20 96 79 MO 19 15 20 98 68 Gigi 11 14 19 78 29 Average 17.00 15.00 19.43 90.14 62.71 Test 3 Total 100 360 99 289 98 311 95 288 96 329 99 329 100 320 81 232 95.43 299.71 * Grade 100.00% 80.28% 86.39% 80.00% 91.39% 91.39% 88.89% 64.44% 83.25% Reference: https://www.youtube.com/watch?vc ZJLJKSP Malist=PLrRPvpgDrwon340MHE594 View Zoom Insert Table Chart Text Shape Media + Gradebook Data Gradebook Summary Net Income Assumption Favo A IC Y Starting B, 90,000 Revenue 107% Expense a 70% w F TI Yd 1. Based on the given assumptions, project net incon 2. Auto-fill months 3. Create formulas to project January and Feburary 4. Create a formula to project January expense by us 5. Create a formula to obtain January net income any 6. Format the table in a professional way 7. Try to manipulate assumptions to do sensitivity ani GO 20 Colabo . T Chart Text Net Income Assumption Hudson Raw Data Media Comment Net Income Projection Zoon Gradeboe Hud Gradebook Summary Starting Revenue $50,000 Revenue growth 10 Expenses of Reverso 70% Revenue Expense Net Income Jan Feb Mar Apr May Jun Aug Sep Oct Dec $50,000 554,500 59.405564.71 $70579576,031 583,899 591,402509,628 5108,595 $118,368 $129,021 $33,000 $38,150 $41.54545,326549.405 553,852 555.699562,981 $69.700 576,016 $82,858 590,115 515,000 $16150517 822519.425521174523,079 $25,157527021529.512.578 525,510 538,706 Net Income Projection of 2020 $11.70 200 0 A 2 3 4 5 6 & 7 8 8 0 Q 3 E R T Y 0 ul T Insert Table Chant Text Shape View Media Comment Net Income Projection Gradebook Data Hudsonly Gradebook Summary Net Income Assumption Hudson Auto Repair 557 $52 $50 Hundson Auto Repair 50 tune up costs $91 578 $93 571 569 $72 589 5104 $74 $62 $65 $85 $97 $38 $68 562 598 5101 $75 $66 $97 583 $75 $105 $68 $105 599 $79 577 $71 $70 $75 $65 569 569 $97 $72 $80 567 562 562 576 S109 574 7 1. Put data into a column 2. Give descriptive statistics (eg, mean, median, range, count, etc): File-Options Add ins Manage Anal.Te 3. Determine grouping 4. Create a table for frequency relative frequency/percent frequency 5. Cate a bar chart for frequency Note: Call formatting
Step by Step Solution
There are 3 Steps involved in it

Get step-by-step solutions from verified subject matter experts