

Question: I need helping understanding how to solve these problems. Paired vs. Unpaired Studies We have talked about paired and unpaired studies. Unpaired studies assign experimental
I need helping understanding how to solve these problems.
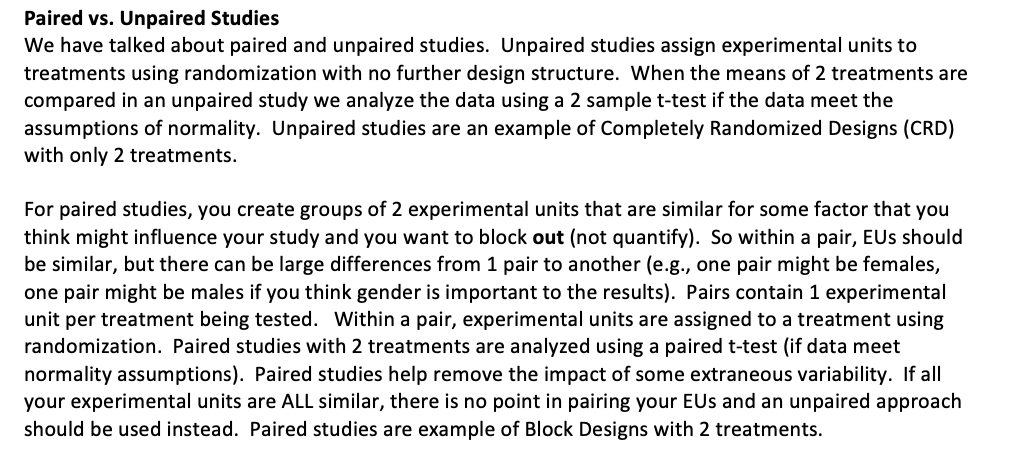
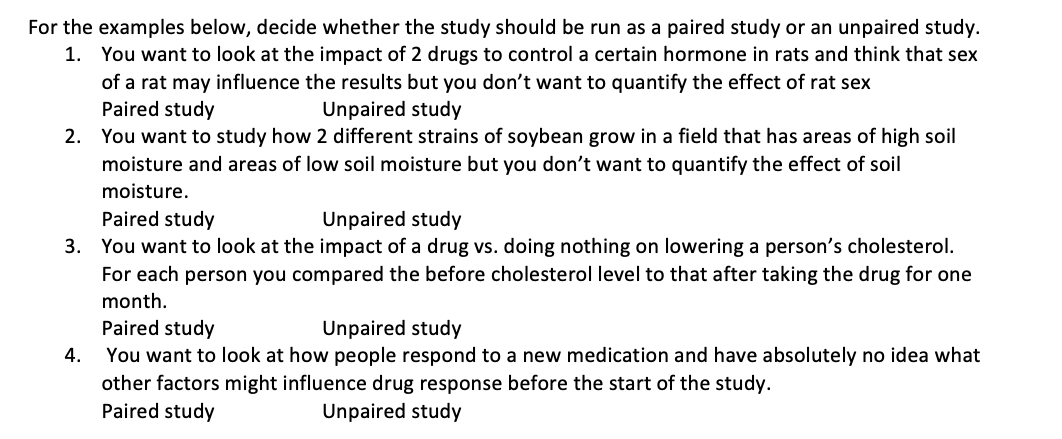
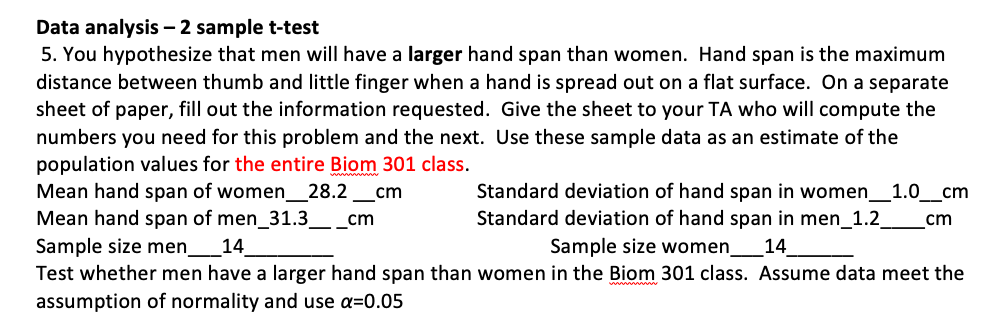
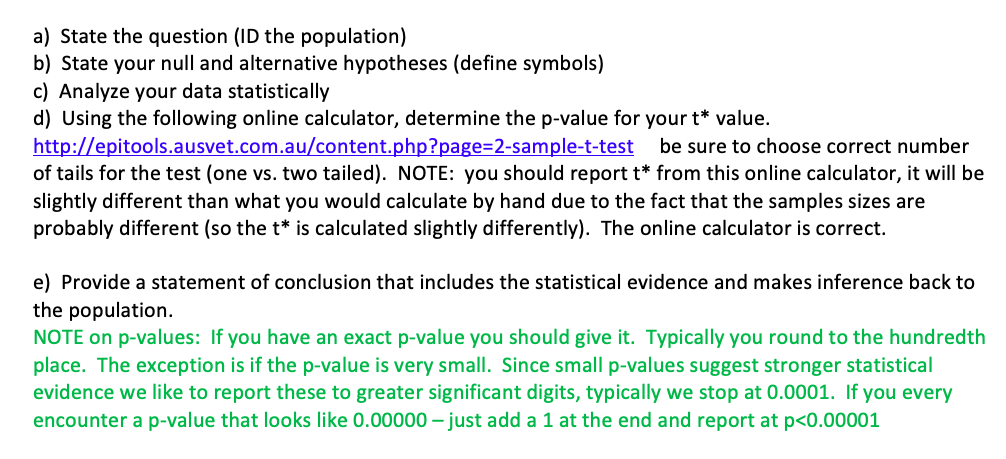
Paired vs. Unpaired Studies We have talked about paired and unpaired studies. Unpaired studies assign experimental units to treatments using randomization with no further design structure. When the means of 2 treatments are compared in an unpaired study we analyze the data using a 2 sample t-test if the data meet the assumptions of normality. Unpaired studies are an example of Completely Randomized Designs (CRD) with only 2 treatments. For paired studies, you create groups of 2 experimental units that are similar for some factor that you think might inuence your study and you want to block out (not quantify}. So within a pair, EUs should be similar, but there can be large differences from 1 pair to another (e.g., one pair might be females, one pair might be males if you think gender is important to the results). Pairs contain 1 experimental unit per treatment being tested. Within a pair, experimental units are assigned to a treatment using randomization. Paired studies with 2 treatments are analyzed using a paired t-test (if data meet normality assumptions}. Paired studies help remove the impact of some extraneous variability. If all your experimental units are ALL similar, there is no point in pairing your EUs and an unpaired approach should be used instead. Paired studies are example of Block Designs with 2 treatments. For the examples below, decide whether the study should be run as a paired study or an unpaired study. 1. You want to look at the impact of 2 drugs to control a certain hormone in rats and think that sex of a rat may influence the results but you don't want to quantify the effect of rat sex Paired study Unpaired study 2. You want to study how 2 different strains of soybean grow in a field that has areas of high soil moisture and areas of low soil moisture but you don't want to quantify the effect of soil moisture. Paired study Unpaired study 3. You want to look at the impact of a drug vs. doing nothing on lowering a person's cholesterol. For each person you compared the before cholesterol level to that after taking the drug for one month. Paired study Unpaired study 4. You want to look at how people respond to a new medication and have absolutely no idea what other factors might influence drug response before the start of the study. Paired study Unpaired study Data analysis - 2 sample t-test 5. You hypothesize that men will have a larger hand span than women. Hand span is the maximum distance between thumb and little finger when a hand is spread out on a flat surface. On a separate sheet of paper, fill out the information requested. Give the sheet to vourTA who will compute the numbers you need for this problem and the next. Use these sample data as an estimate ofthe population values for the entire Biom 301 class. Mean hand span of women_28.2 _cm Standard deviation of hand span in women_1.0_cm Mean hand span of men_31.3_ _cm Standard deviation of hand span in men_1.2 cm Sample size men14 Sample size women14 Test whether men have a larger hand span than women in the Biom 301 class. Assume data meet the assumption of normality and use a=0.05 a] State the question (ID the population} b) State your null and alternative hypotheses (define symbols) c) Analyze your data statistically d) Using the following online calculator, determine the p-value for your t* value. http:epitoolsausvetcom.au/content.php?page=2-sampIe-t-test be sure to choose correct number of tails for the test (one vs. two tailed). NOTE: you should report t* from this online calculator, it will be slightly different than what you would calculate by hand due to the fact that the samples sizes are probably different (so the t\" is calculated slightly differently). The online calculator is correct. e) Provide a statement of conclusion that includes the statistical evidence and makes inference back to the population. NOTE on pvalues: If you have an exact p-value you should give it. Typically you round to the hundredth place. The exception is if the p-value is very small. Since small p-values suggest stronger statistical evidence we like to report these to greater significant digits, typically we stop at 0.0001. If you every encounter a p-value that looks like 0.00000 just add a 1 at the end and report at p
Step by Step Solution
There are 3 Steps involved in it

Get step-by-step solutions from verified subject matter experts