

Question: I need solve this question of Probability & Statistic for Engineers Question 2. Three events are shown on the Venn diagram in the following figure:
I need solve this question of Probability & Statistic for Engineers

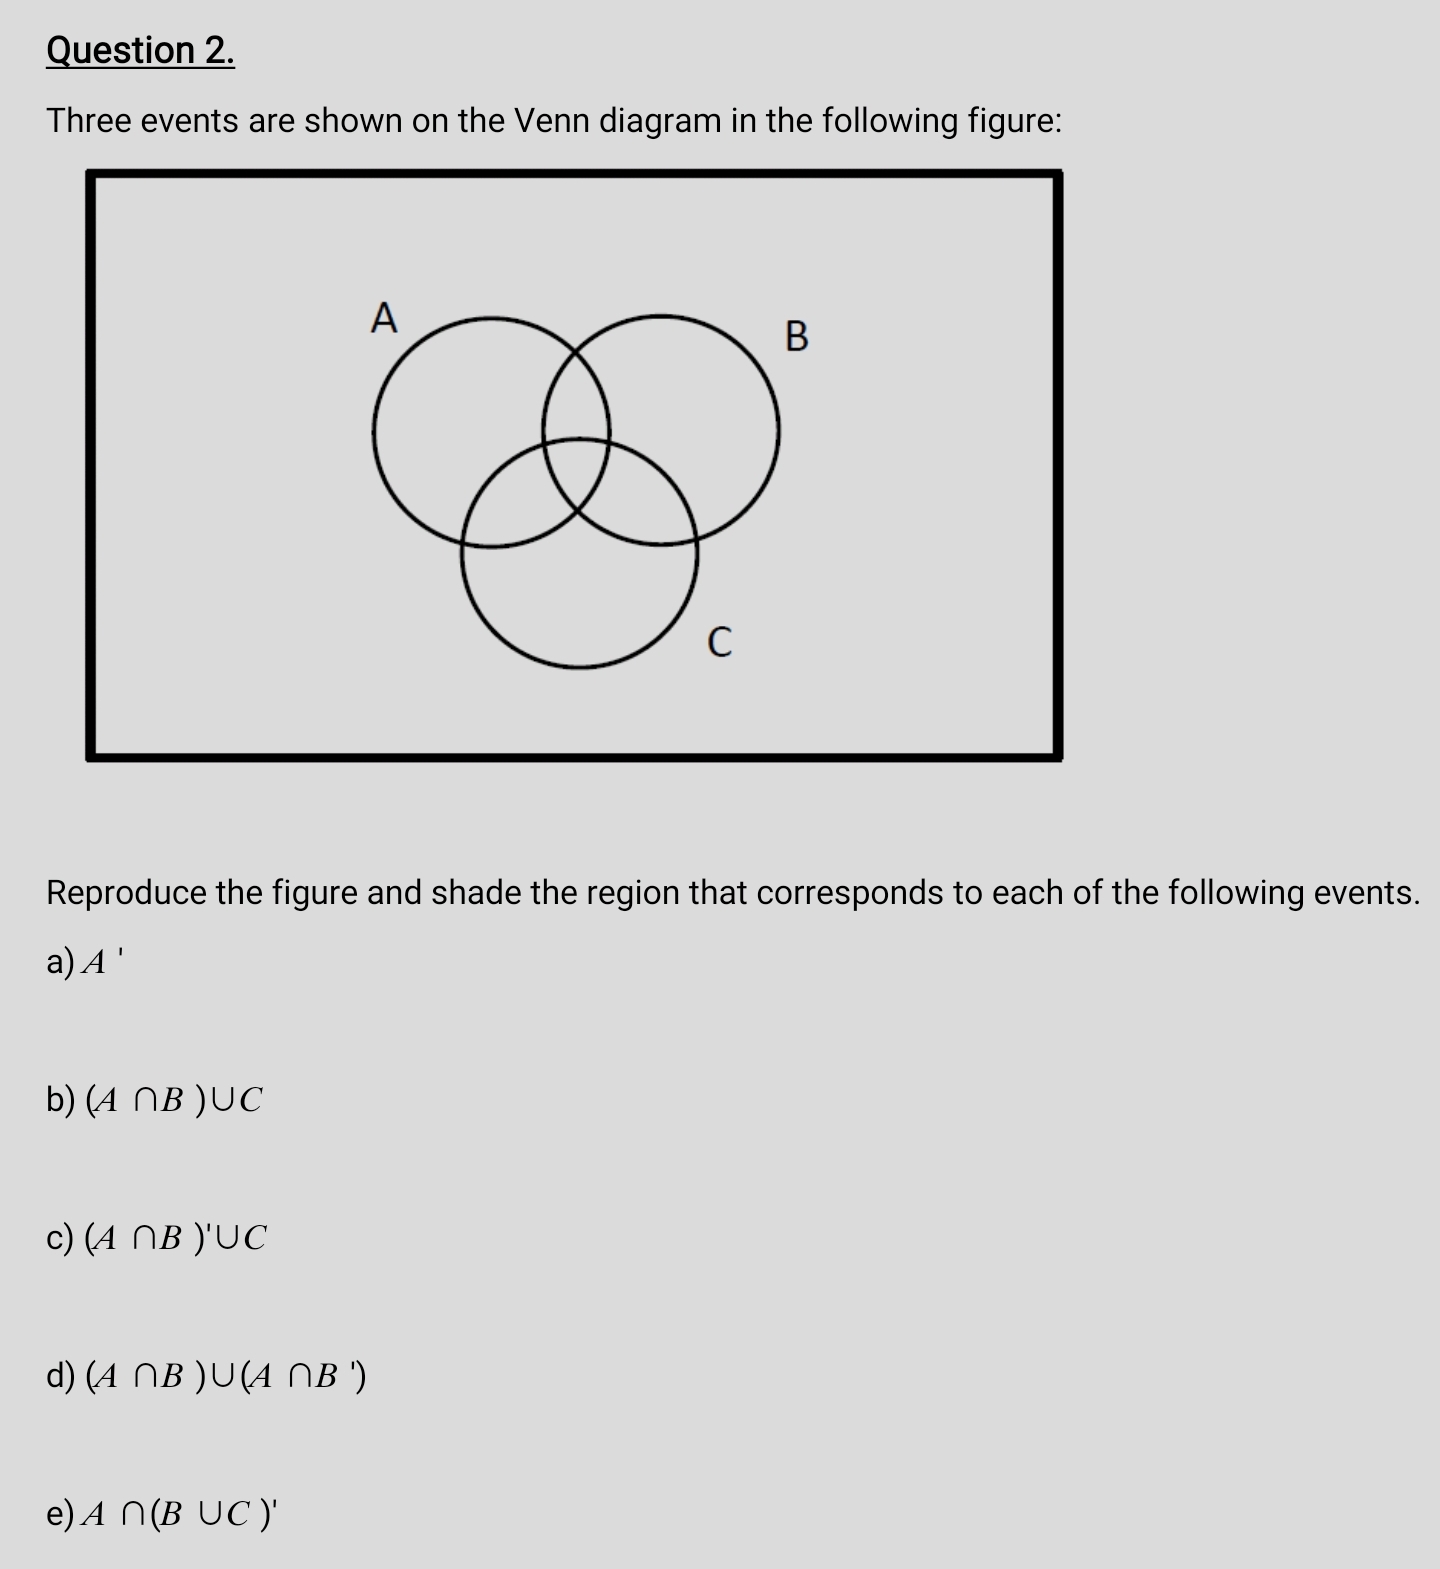
Question 2. Three events are shown on the Venn diagram in the following figure: B Reproduce the figure and shade the region that corresponds to each of the following events. a) A ' b) ( A n B ) UC C) (A nB )'UC d) ( A n B ) U( A n B ' ) e) A n(B UC)
Step by Step Solution
There are 3 Steps involved in it
1 Expert Approved Answer
Step: 1 Unlock

Question Has Been Solved by an Expert!
Get step-by-step solutions from verified subject matter experts
Step: 2 Unlock
Step: 3 Unlock