

Question: i need the answer for task 4. The following table of information is useful for task 2, task 3 and task 4. (Data only for
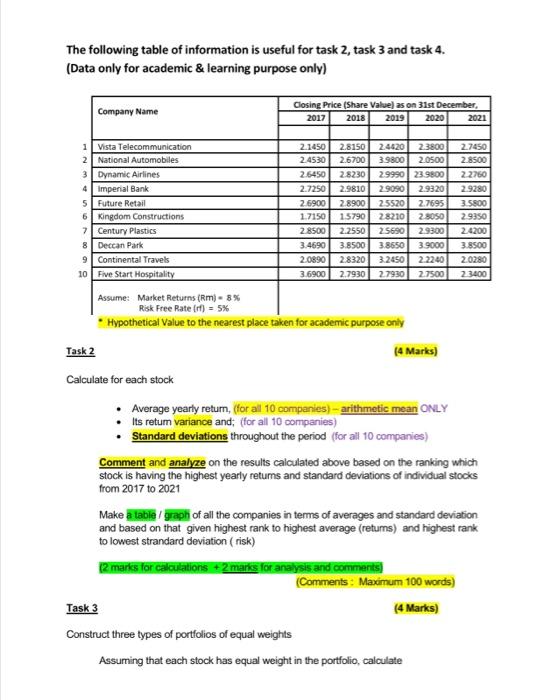
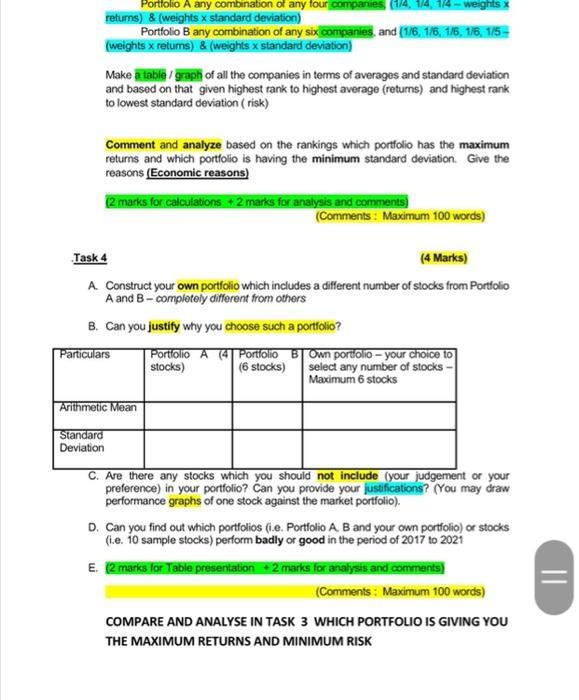
The following table of information is useful for task 2, task 3 and task 4. (Data only for academic & learning purpose only) Company Name Closing Price (Share Value) as on 31st December 2017 2018 2019 2020 2021 1 Vista Telecommunication 2 National Automobiles 3 Dynamic Airlines 4 Imperial Bank 5 Future Retail 6 Kingdom Constructions 7 Century Plastics 8 Deccan Park 9 Continental Travels 10 Five Start Hospitality 2.1450 24530 2.6450 2.7250 2.6900 1.7150 28SOO 3.4690 2.0890 3.6900 2.8150 24420 23800 2.6700 3.9800 2.0500 2.8230 2.9990 23.9800 2.9810 2.9090 2.9320 2.8900 2.5520 2.7695 1.5790 28210 2.8050 2.2550 2.5690 2.9300 3.8500 3.8650 3.9000 2.8320 3.2450 2.2240 2.7930 27930 2.7500 2.7450 2.8500 2.2760 2.9280 3.5800 29350 24200 3.8500 20280 2.3400 Assume: Market Returns (Rm - 8% Risk Free Rate (rf) - 5% Hypothetical Value to the nearest place taken for academic purpose only Task 2 (4 Marks) Calculate for each stock Average yearly retum, (for all 10 companies) - arithmetic mean ONLY Its retum variance and, (for all 10 companies) Standard deviations throughout the period (for all 10 companies) Comment and analyze on the results calculated above based on the ranking which stock is having the highest yearly retums and standard deviations of individual stocks from 2017 to 2021 Make a table / graph of all the companies in terms of averages and standard deviation and based on that given highest rank to highest average (returns) and highest rank to lowest strandard deviation (risk) 2 marks for calculations +2 marks for analysis and comments Comments : Maximum 100 words) Task 3 (4 Marks) Construct three types of portfolios of equal weights Assuming that each stock has equal weight in the portfolio, calculate Portfolio A any combination of any four companies (1/4, 1/4, 1/4 - weights x retums) & (weights x standard deviation) Portfolio B any combination of any six companies, and (116, 116, 116, 116, 115 (weights x retums) & (weights x standard deviation) Make a table/graph of all the companies in terms of averages and standard deviation and based on that given highest rank to highest average (returns) and highest rank to lowest standard deviation (risk) Comment and analyze based on the rankings which portfolio has the maximum returns and which portfolio is having the minimum standard deviation. Give the reasons (Economic reasons) (2 marks for calculations + 2 marks for analysis and comments (Comments : Maximum 100 words) Task 4 (4 Marks) A Construct your own portfolio which includes a different number of stocks from Portfolio A and B - completely different from others B. Can you justify why you choose such a portfolio? Particulars Portfolio A 4 Portfolio B Own porfolio - your choice to stocks) (6 stocks) select any number of stocks - Maximum 6 stocks Arithmetic Mean Standard Deviation C. Are there any stocks which you should not include (your judgement or your preference) in your portfolio? Can you provide your justifications? (You may draw performance graphs of one stock against the market portfolio). D. Can you find out which portfolios (.e. Portfolio A. B and your own portfolio) or stocks (i.e. 10 sample stocks) perform badly or good in the period of 2017 to 2021 E. (2 marks for Table presentation 2 marks for analysis and comments (Comments : Maximum 100 words) COMPARE AND ANALYSE IN TASK 3 WHICH PORTFOLIO IS GIVING YOU THE MAXIMUM RETURNS AND MINIMUM RISK II The following table of information is useful for task 2, task 3 and task 4. (Data only for academic & learning purpose only) Company Name Closing Price (Share Value) as on 31st December 2017 2018 2019 2020 2021 1 Vista Telecommunication 2 National Automobiles 3 Dynamic Airlines 4 Imperial Bank 5 Future Retail 6 Kingdom Constructions 7 Century Plastics 8 Deccan Park 9 Continental Travels 10 Five Start Hospitality 2.1450 24530 2.6450 2.7250 2.6900 1.7150 28SOO 3.4690 2.0890 3.6900 2.8150 24420 23800 2.6700 3.9800 2.0500 2.8230 2.9990 23.9800 2.9810 2.9090 2.9320 2.8900 2.5520 2.7695 1.5790 28210 2.8050 2.2550 2.5690 2.9300 3.8500 3.8650 3.9000 2.8320 3.2450 2.2240 2.7930 27930 2.7500 2.7450 2.8500 2.2760 2.9280 3.5800 29350 24200 3.8500 20280 2.3400 Assume: Market Returns (Rm - 8% Risk Free Rate (rf) - 5% Hypothetical Value to the nearest place taken for academic purpose only Task 2 (4 Marks) Calculate for each stock Average yearly retum, (for all 10 companies) - arithmetic mean ONLY Its retum variance and, (for all 10 companies) Standard deviations throughout the period (for all 10 companies) Comment and analyze on the results calculated above based on the ranking which stock is having the highest yearly retums and standard deviations of individual stocks from 2017 to 2021 Make a table / graph of all the companies in terms of averages and standard deviation and based on that given highest rank to highest average (returns) and highest rank to lowest strandard deviation (risk) 2 marks for calculations +2 marks for analysis and comments Comments : Maximum 100 words) Task 3 (4 Marks) Construct three types of portfolios of equal weights Assuming that each stock has equal weight in the portfolio, calculate Portfolio A any combination of any four companies (1/4, 1/4, 1/4 - weights x retums) & (weights x standard deviation) Portfolio B any combination of any six companies, and (116, 116, 116, 116, 115 (weights x retums) & (weights x standard deviation) Make a table/graph of all the companies in terms of averages and standard deviation and based on that given highest rank to highest average (returns) and highest rank to lowest standard deviation (risk) Comment and analyze based on the rankings which portfolio has the maximum returns and which portfolio is having the minimum standard deviation. Give the reasons (Economic reasons) (2 marks for calculations + 2 marks for analysis and comments (Comments : Maximum 100 words) Task 4 (4 Marks) A Construct your own portfolio which includes a different number of stocks from Portfolio A and B - completely different from others B. Can you justify why you choose such a portfolio? Particulars Portfolio A 4 Portfolio B Own porfolio - your choice to stocks) (6 stocks) select any number of stocks - Maximum 6 stocks Arithmetic Mean Standard Deviation C. Are there any stocks which you should not include (your judgement or your preference) in your portfolio? Can you provide your justifications? (You may draw performance graphs of one stock against the market portfolio). D. Can you find out which portfolios (.e. Portfolio A. B and your own portfolio) or stocks (i.e. 10 sample stocks) perform badly or good in the period of 2017 to 2021 E. (2 marks for Table presentation 2 marks for analysis and comments (Comments : Maximum 100 words) COMPARE AND ANALYSE IN TASK 3 WHICH PORTFOLIO IS GIVING YOU THE MAXIMUM RETURNS AND MINIMUM RISK
Step by Step Solution
There are 3 Steps involved in it

Get step-by-step solutions from verified subject matter experts