

Question: I need the answer to #10 based on the data from #9. product 7.68 781 8.11 828 809 8.16 789 7.938.09 2.16 797 8.07 81
I need the answer to #10 based on the data from #9. 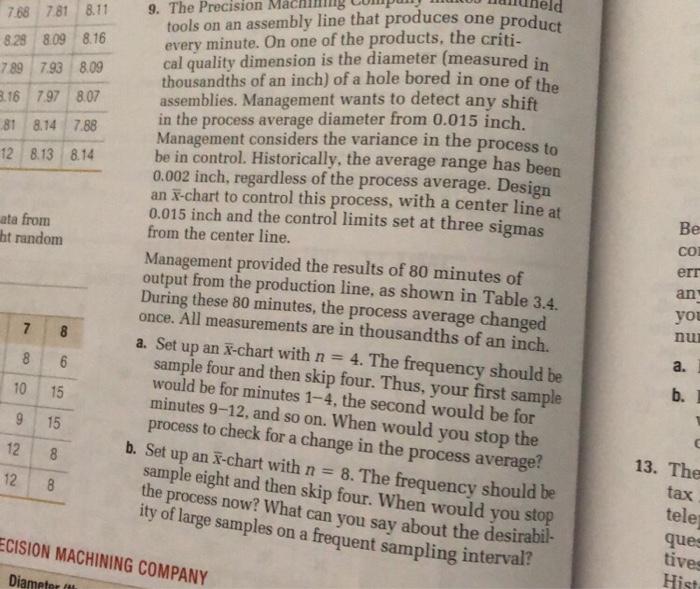
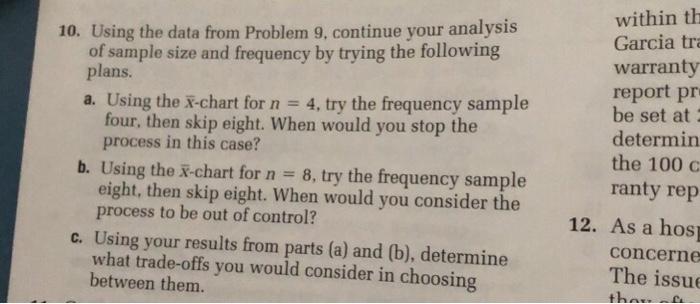
product 7.68 781 8.11 828 809 8.16 789 7.938.09 2.16 797 8.07 81 8.14 7.88 128.13 8.14 9. The Precision tools on an assembly line that produces one every minute. On one of the products, the criti- cal quality dimension is the diameter (measured in thousandths of an inch) of a hole bored in one of the a assemblies. Management wants to detect any shift in the process average diameter from 0.015 inch. Management considers the variance in the process to be in control. Historically, the average range has been 0.002 inch, regardless of the process average. Design an X-chart to control this process, with a center line at 0.015 inch and the control limits set at three sigmas from the center line. Management provided the results of 80 minutes of output from the production line, as shown in Table 3.4. a ata from ht random Be co err an you nu 7 8 CO 8 6 a. 10 15 b. During these 80 minutes, the process average changed once. All measurements are in thousandths of an inch. a. Set up an X-chart with n = 4. The frequency should be sample four and then skip four. Thus, your first sample would be for minutes 1-4, the second would be for minutes 9-12, and so on. When would you stop the process to check for a change in the process average? b. Set up an x-chart with n= 8. The frequency should be sample eight and then skip four. When would you stop the process now? What can you say about the desirabil- ity of large samples on a frequent sampling interval? 915 a 12 C 8 12 8 13. The tax tele ques tives Hist a ECISION MACHINING COMPANY Diameter til 10. Using the data from Problem 9, continue your analysis of sample size and frequency by trying the following plans. a. Using the x-chart for n = 4, try the frequency sample four, then skip eight. When would you stop the process in this case? b. Using the X-chart for n = 8, try the frequency sample eight, then skip eight. When would you consider the process to be out of control? within th Garcia tra warranty report pr be set at determin the 100 C ranty rep 12. As a hos concerne The issue tha c. Using your results from parts (a) and (b), determine what trade-offs you would consider in choosing between them. product 7.68 781 8.11 828 809 8.16 789 7.938.09 2.16 797 8.07 81 8.14 7.88 128.13 8.14 9. The Precision tools on an assembly line that produces one every minute. On one of the products, the criti- cal quality dimension is the diameter (measured in thousandths of an inch) of a hole bored in one of the a assemblies. Management wants to detect any shift in the process average diameter from 0.015 inch. Management considers the variance in the process to be in control. Historically, the average range has been 0.002 inch, regardless of the process average. Design an X-chart to control this process, with a center line at 0.015 inch and the control limits set at three sigmas from the center line. Management provided the results of 80 minutes of output from the production line, as shown in Table 3.4. a ata from ht random Be co err an you nu 7 8 CO 8 6 a. 10 15 b. During these 80 minutes, the process average changed once. All measurements are in thousandths of an inch. a. Set up an X-chart with n = 4. The frequency should be sample four and then skip four. Thus, your first sample would be for minutes 1-4, the second would be for minutes 9-12, and so on. When would you stop the process to check for a change in the process average? b. Set up an x-chart with n= 8. The frequency should be sample eight and then skip four. When would you stop the process now? What can you say about the desirabil- ity of large samples on a frequent sampling interval? 915 a 12 C 8 12 8 13. The tax tele ques tives Hist a ECISION MACHINING COMPANY Diameter til 10. Using the data from Problem 9, continue your analysis of sample size and frequency by trying the following plans. a. Using the x-chart for n = 4, try the frequency sample four, then skip eight. When would you stop the process in this case? b. Using the X-chart for n = 8, try the frequency sample eight, then skip eight. When would you consider the process to be out of control? within th Garcia tra warranty report pr be set at determin the 100 C ranty rep 12. As a hos concerne The issue tha c. Using your results from parts (a) and (b), determine what trade-offs you would consider in choosing between them Step by Step Solution
There are 3 Steps involved in it
1 Expert Approved Answer
Step: 1 Unlock

Question Has Been Solved by an Expert!
Get step-by-step solutions from verified subject matter experts
Step: 2 Unlock
Step: 3 Unlock