

Question: I need the answer to part C. ONLY An automatic the produces rollers for roller bearings, and the process is monitored by stations control charts.
I need the answer to part C. ONLY 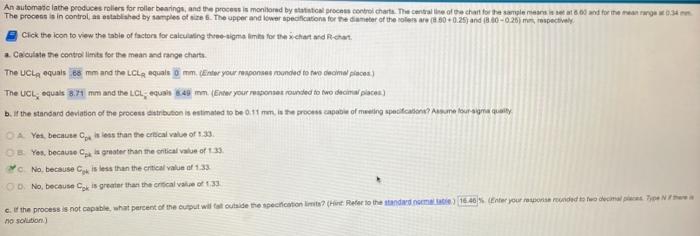
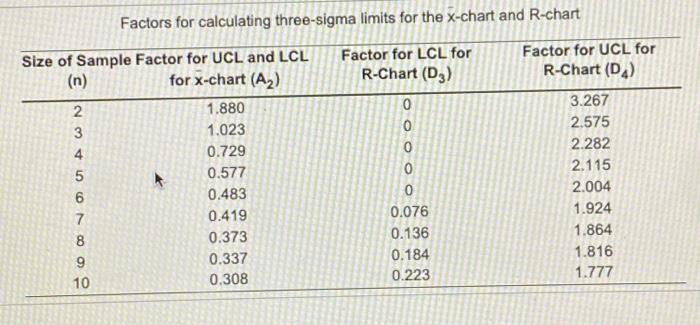
An automatic the produces rollers for roller bearings, and the process is monitored by stations control charts. The centralne of the chart for the same The process is in control as established by samples of the upper and lower specifications for the diameter of the role and for the manager and (8.00 -0.25), ospectively Click the icon to view the table of factors for calculating the time time for the chart and can a. Calculate the controlimits for the mean and range charts. The UCLa quals 8 mm and the LCL aquals 0 mm. (Enter your responses rounoud to rave onome places) The UCL, equals 3.71 mm and the LCL equals 48 mm. (Enter your responsert rounded to two deca place) b. If the standard deviation of the process distribution is estimated to be 0.11 m. Is the promis capable of meeting specialisme tu pra qually A Yes because pass than the critical value of 33 DB Yes, because groter than the critical value of 1.33. No, because is less than the critical value of 133 No, because Cok is greater than the critical value of 133 c. the process is not capable, what percent of the turbut will outside the spection limit (Hot Refer to the standard 16.465 Enter your add to welcome no solution Factors for calculating three-sigma limits for the x-chart and R-chart Factor for LCL for R-Chart (D3) Size of Sample Factor for UCL and LCL (n) for X-chart (A) 2 1.880 3 1.023 4. 0.729 5 0.577 0.483 7 0.419 8 0.373 9 0.337 10 0.308 COWN 0 0 0 0 0 0.076 0.136 0.184 0.223 Factor for UCL for R-Chart (D) 3.267 2.575 2.282 2.115 2.004 1.924 1.864 1.816 1.777
Step by Step Solution
There are 3 Steps involved in it
1 Expert Approved Answer
Step: 1 Unlock

Question Has Been Solved by an Expert!
Get step-by-step solutions from verified subject matter experts
Step: 2 Unlock
Step: 3 Unlock