

Question: I need the R code that will produce this plot. It is using the data called mpg in tidyverse in R. From there it needs
I need the R code that will produce this plot. It is using the data called mpg in tidyverse in R. From there it needs to be a geom_point function using ggplot. However I don't understand how to make those selected points red. 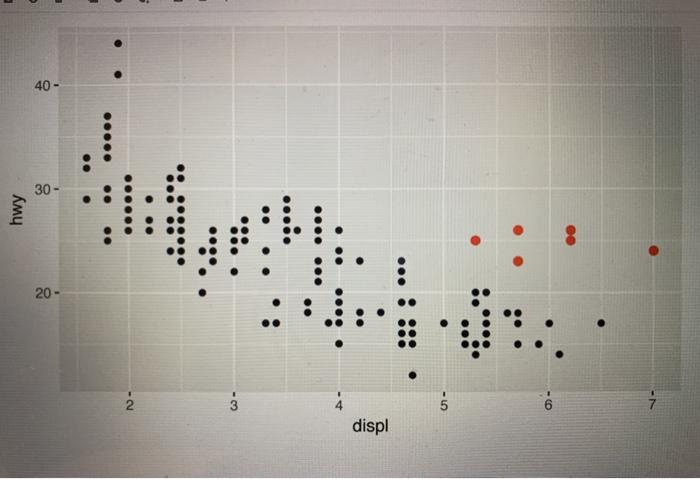
40- 30- hwy 20- 4 on - displ
Step by Step Solution
There are 3 Steps involved in it
1 Expert Approved Answer
Step: 1 Unlock

Question Has Been Solved by an Expert!
Get step-by-step solutions from verified subject matter experts
Step: 2 Unlock
Step: 3 Unlock