Question: I need this problem answered using the Winters method which is shown in the text book Supply Chain Management by Sunil Chopra.Thank you CASE STUDY
I need this problem answered using the Winters method which is shown in the text book "Supply Chain Management" by Sunil Chopra.Thank you
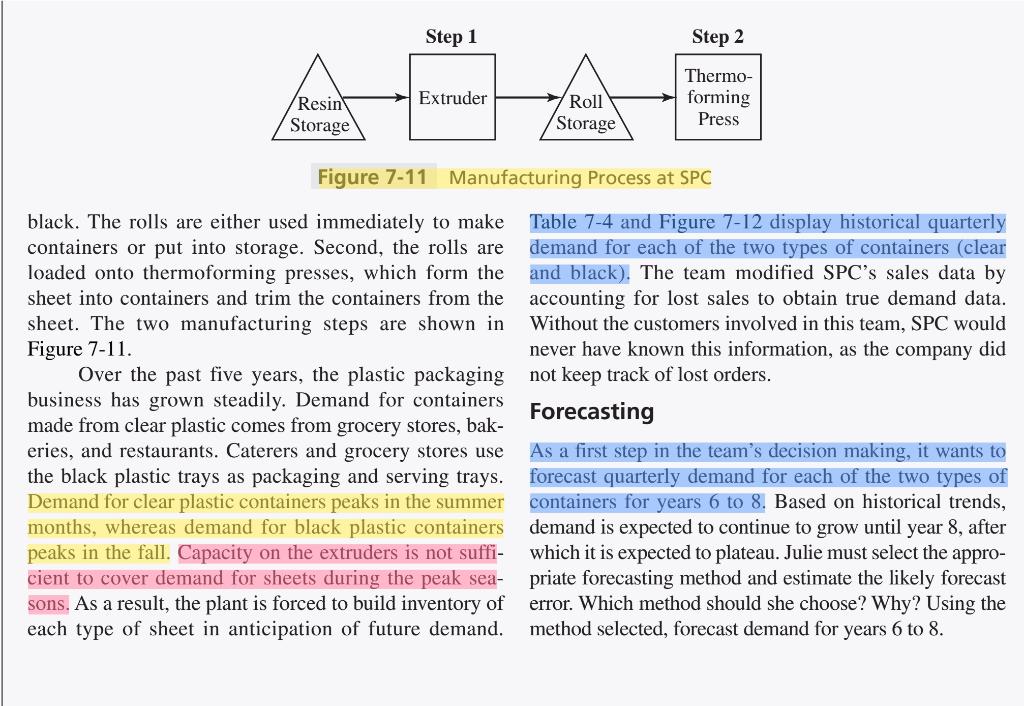
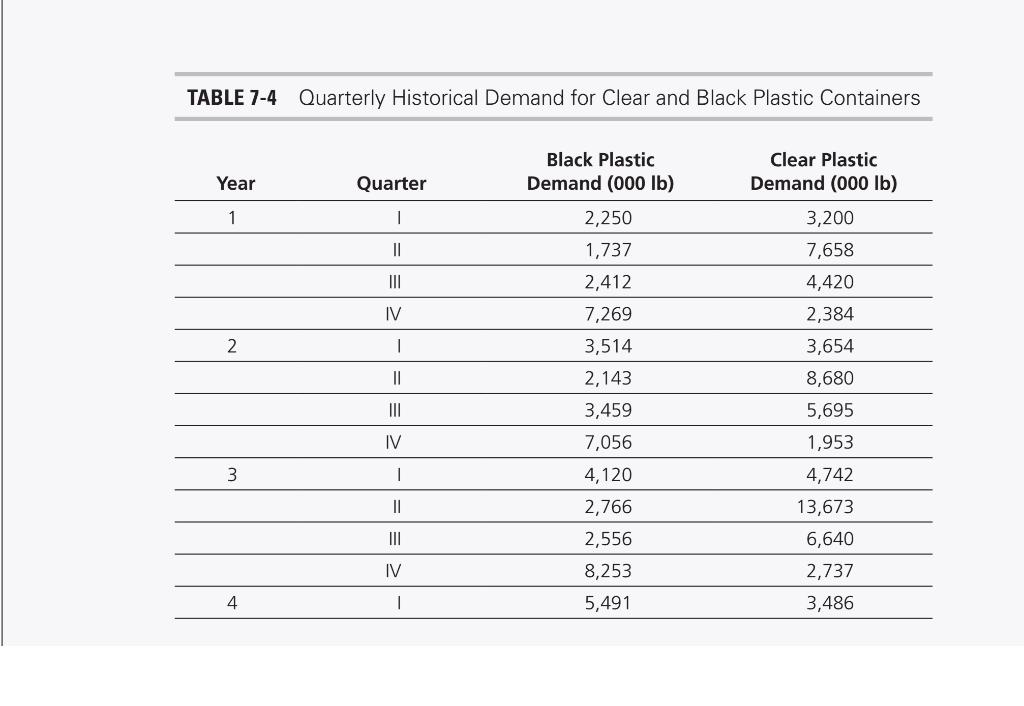
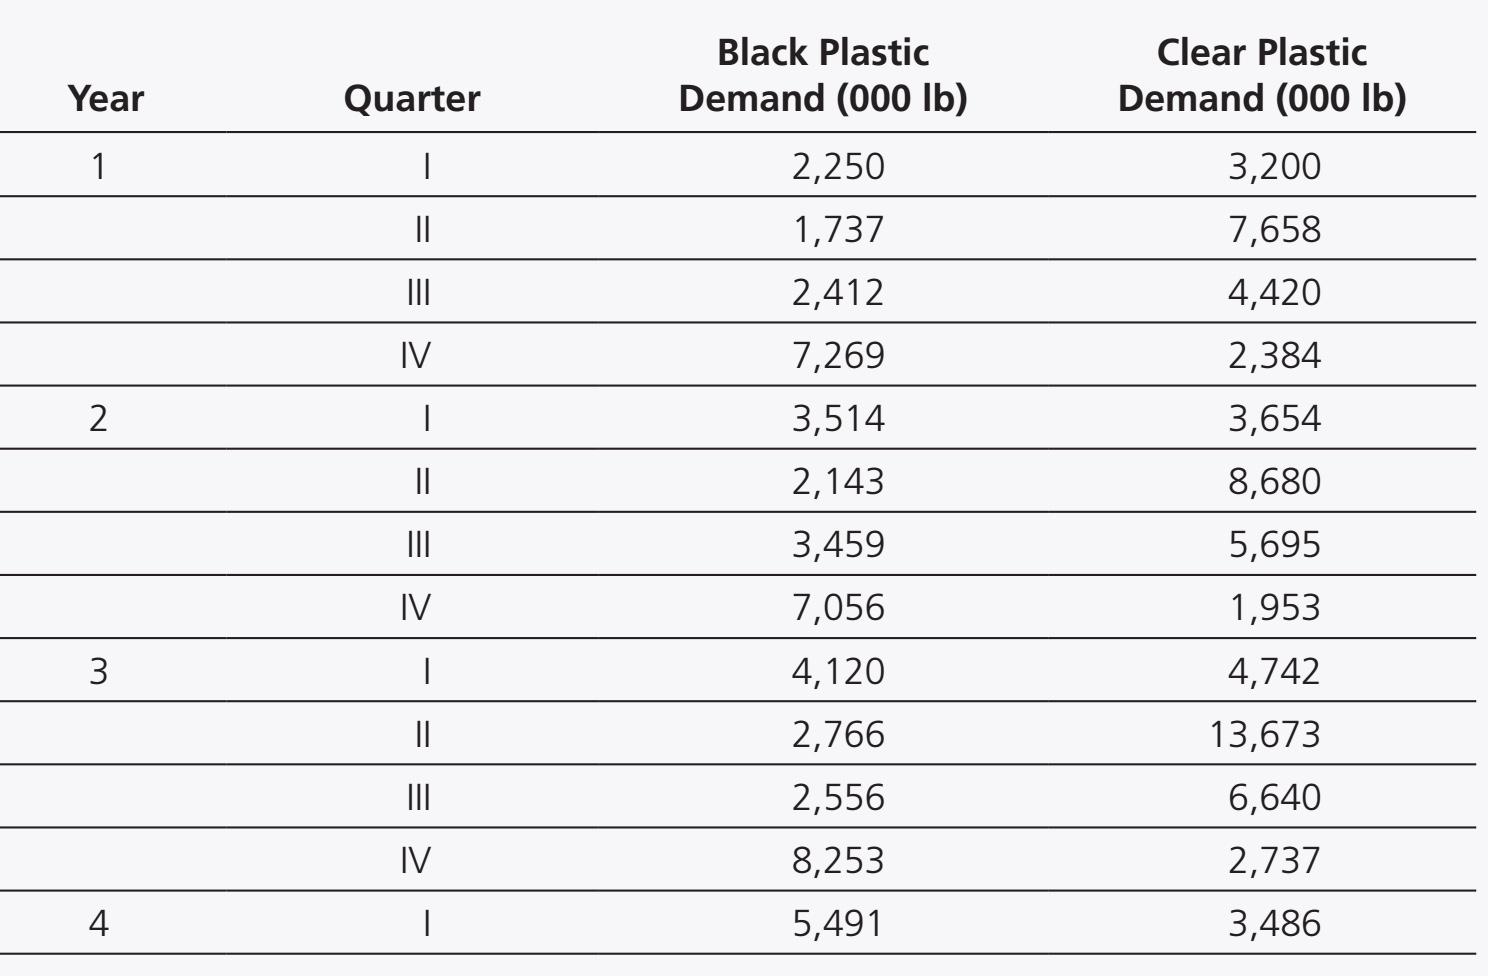
CASE STUDY Specialty Packaging Corporation Julie Williams had a lot on her mind when she left the performance, as managers could use this more accurate conference room at Specialty Packaging Corporation forecast for their production planning. Improved fore- (SPC). Her divisional manager had informed her that she casts would allow SPC to improve delivery would be assigned to a team consisting of SPC's market- performance. ing vice president and staff members from their key cus- tomers. The goal of this team was to improve supply SPC chain performance, as SPC had been unable to meet demand effectively over the previous several years. This SPC turns polystyrene resin into recyclable/disposable often left SPC's customers scrambling to meet new cli- containers for the food industry. Polystyrene is pur- ent demands. Julie had little contact with SPC's custom- chased as a commodity in the form of resin pellets. The ers and wondered how she would add value to this resin is unloaded from bulk rail containers or overland process. She was told by her division manager that the trailers into storage silos. Making the food containers is team's first task was to establish a collaborative forecast a two-step process. First, resin is conveyed to an extruder, using data from both SPC and its customers. This fore- which converts it into a polystyrene sheet that is wound cast would serve as the basis for improving the firm's into rolls. The plastic comes in two formsclear and Step 1 Step 2 Extruder Resin Storage Roll Storage Thermo- forming Press Figure 7-11 Manufacturing Process at SPC black. The rolls are either used immediately to make Table 7-4 and Figure 7-12 display historical quarterly containers or put into storage. Second, the rolls are demand for each of the two types of containers (clear loaded onto thermoforming presses, which form the and black). The team modified SPC's sales data by sheet into containers and trim the containers from the accounting for lost sales to obtain true demand data. sheet. The two manufacturing steps are shown in Without the customers involved in this team, SPC would Figure 7-11. never have known this information, as the company did Over the past five years, the plastic packaging not keep track of lost orders. business has grown steadily. Demand for containers made from clear plastic comes from grocery stores, bak- Forecasting eries, and restaurants. Caterers and grocery stores use As a first step in the team's decision making, it wants to the black plastic trays as packaging and serving trays. forecast quarterly demand for each of the two types of Demand for clear plastic containers peaks in the summer containers for years 6 to 8. Based on historical trends, months, whereas demand for black plastic containers demand is expected to continue to grow until year 8, after peaks in the fall. Capacity on the extruders is not suffi- which it is expected to plateau. Julie must select the appro- cient to cover demand for sheets during the peak sea- priate forecasting method and estimate the likely forecast sons. As a result, the plant is forced to build inventory of error. Which method should she choose? Why? Using the each type of sheet in anticipation of future demand. method selected, forecast demand for years 6 to 8. TABLE 7-4 Quarterly Historical Demand for Clear and Black Plastic Containers Year Clear Plastic Demand (000 lb) Quarter Black Plastic Demand (000 lb) 2,250 1,737 1 1 II III 3,200 7,658 4,420 2,384 3,654 2,412 7,269 3,514 IV 2 1 II 2,143 8,680 5,695 III 3,459 IV 3 1 II 7,056 4,120 2,766 2,556 8,253 5,491 1,953 4,742 13,673 6,640 2,737 3,486 III IV 4 1 Black Plastic Demand (000 lb) Clear Plastic Demand (000 lb) Year Quarter 1 | 2,250 3,200 II 1,737 7,658 III 2,412 4,420 IV 7,269 2,384 1 3,514 3,654 N II 2,143 8,680 5,695 III 3,459 IV 7,056 1,953 3 | 4,120 4,742 II 13,673 2,766 2,556 III 6,640 IV 8,253 2,737 4 1 5,491 3,486


