

Question: I need to find the Upper and lower limits for both X and R charts. Thirty-five samples of size 7 each were taken from a
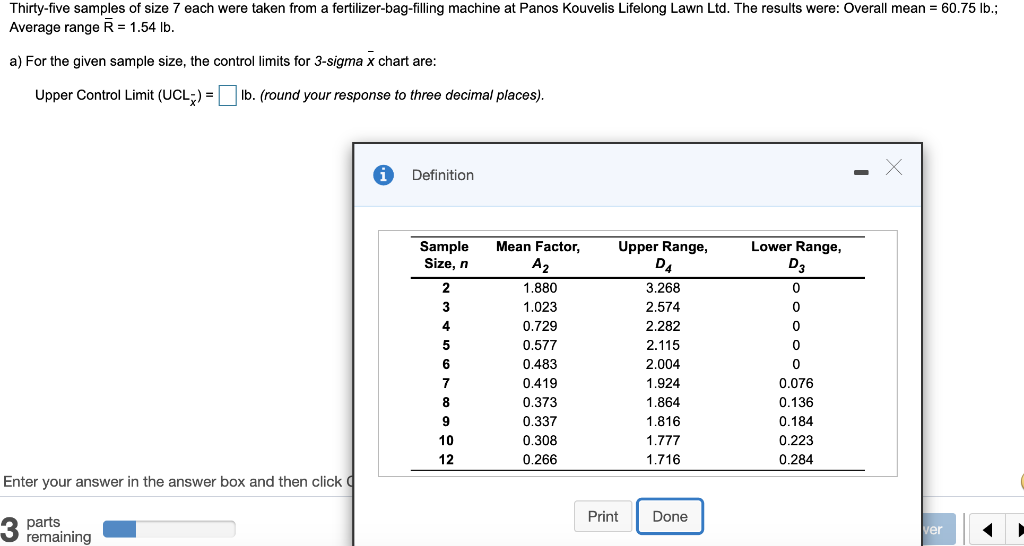 I need to find the Upper and lower limits for both X and R charts.
Step by Step Solution
There are 3 Steps involved in it
1 Expert Approved Answer
Step: 1 Unlock

Question Has Been Solved by an Expert!
Get step-by-step solutions from verified subject matter experts
Step: 2 Unlock
Step: 3 Unlock