

Question: I need to learn this please The data given below show the number of overtime hours worked in one week per employee, Use the data
I need to learn this please
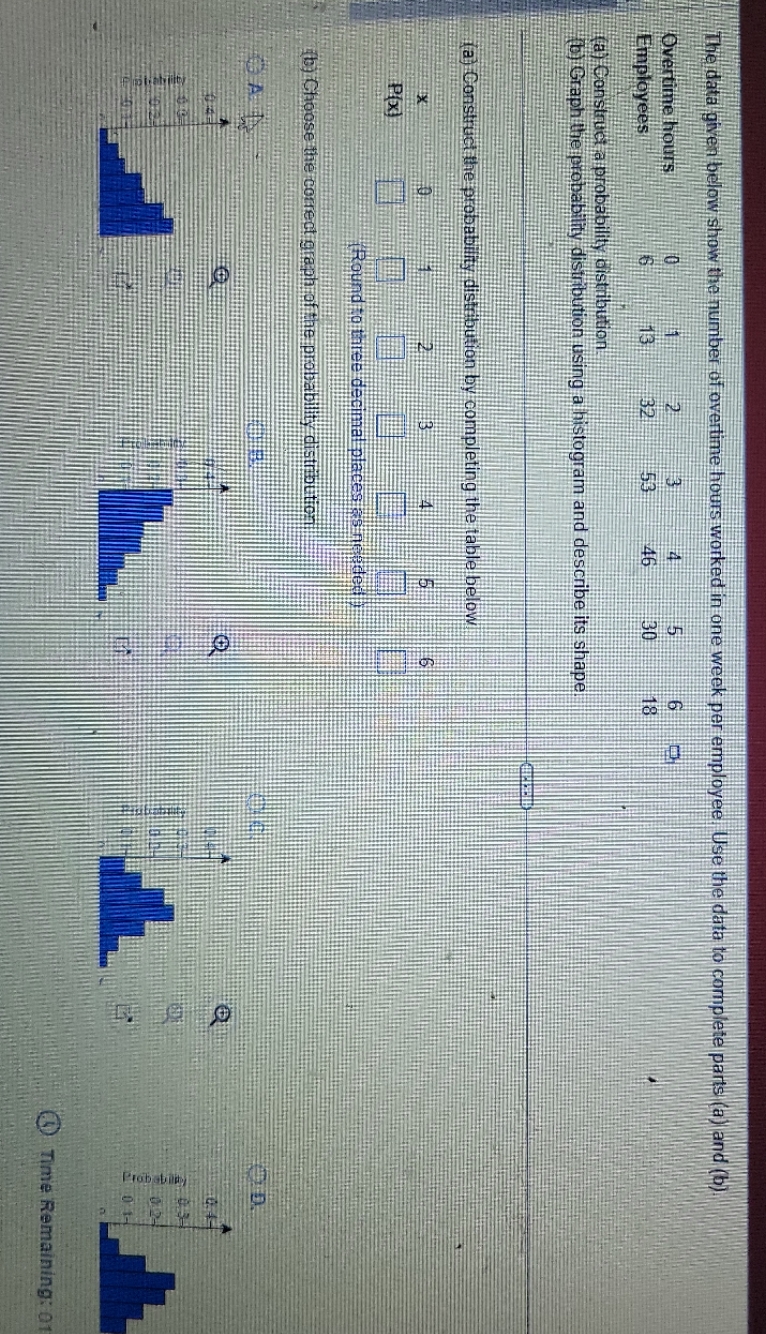
The data given below show the number of overtime hours worked in one week per employee, Use the data to complete parts (a) and (b) Overtime hours Employees (a) Construct a probability distribution (b) Graph the probability distribution using a histogram and describe its shape ia Construct the probability distribution by completing the table below i Round to three decimal places as no litdealt The Choose the correct graph of the probability distribution Probjet Time Remaining: 01
Step by Step Solution
There are 3 Steps involved in it
1 Expert Approved Answer
Step: 1 Unlock

Question Has Been Solved by an Expert!
Get step-by-step solutions from verified subject matter experts
Step: 2 Unlock
Step: 3 Unlock