

Question: I provided a screenshot to help A nancial analyst is examining the relationship between stock prices and earnings per share. She chooses sixteen publicly traded
I provided a screenshot to help
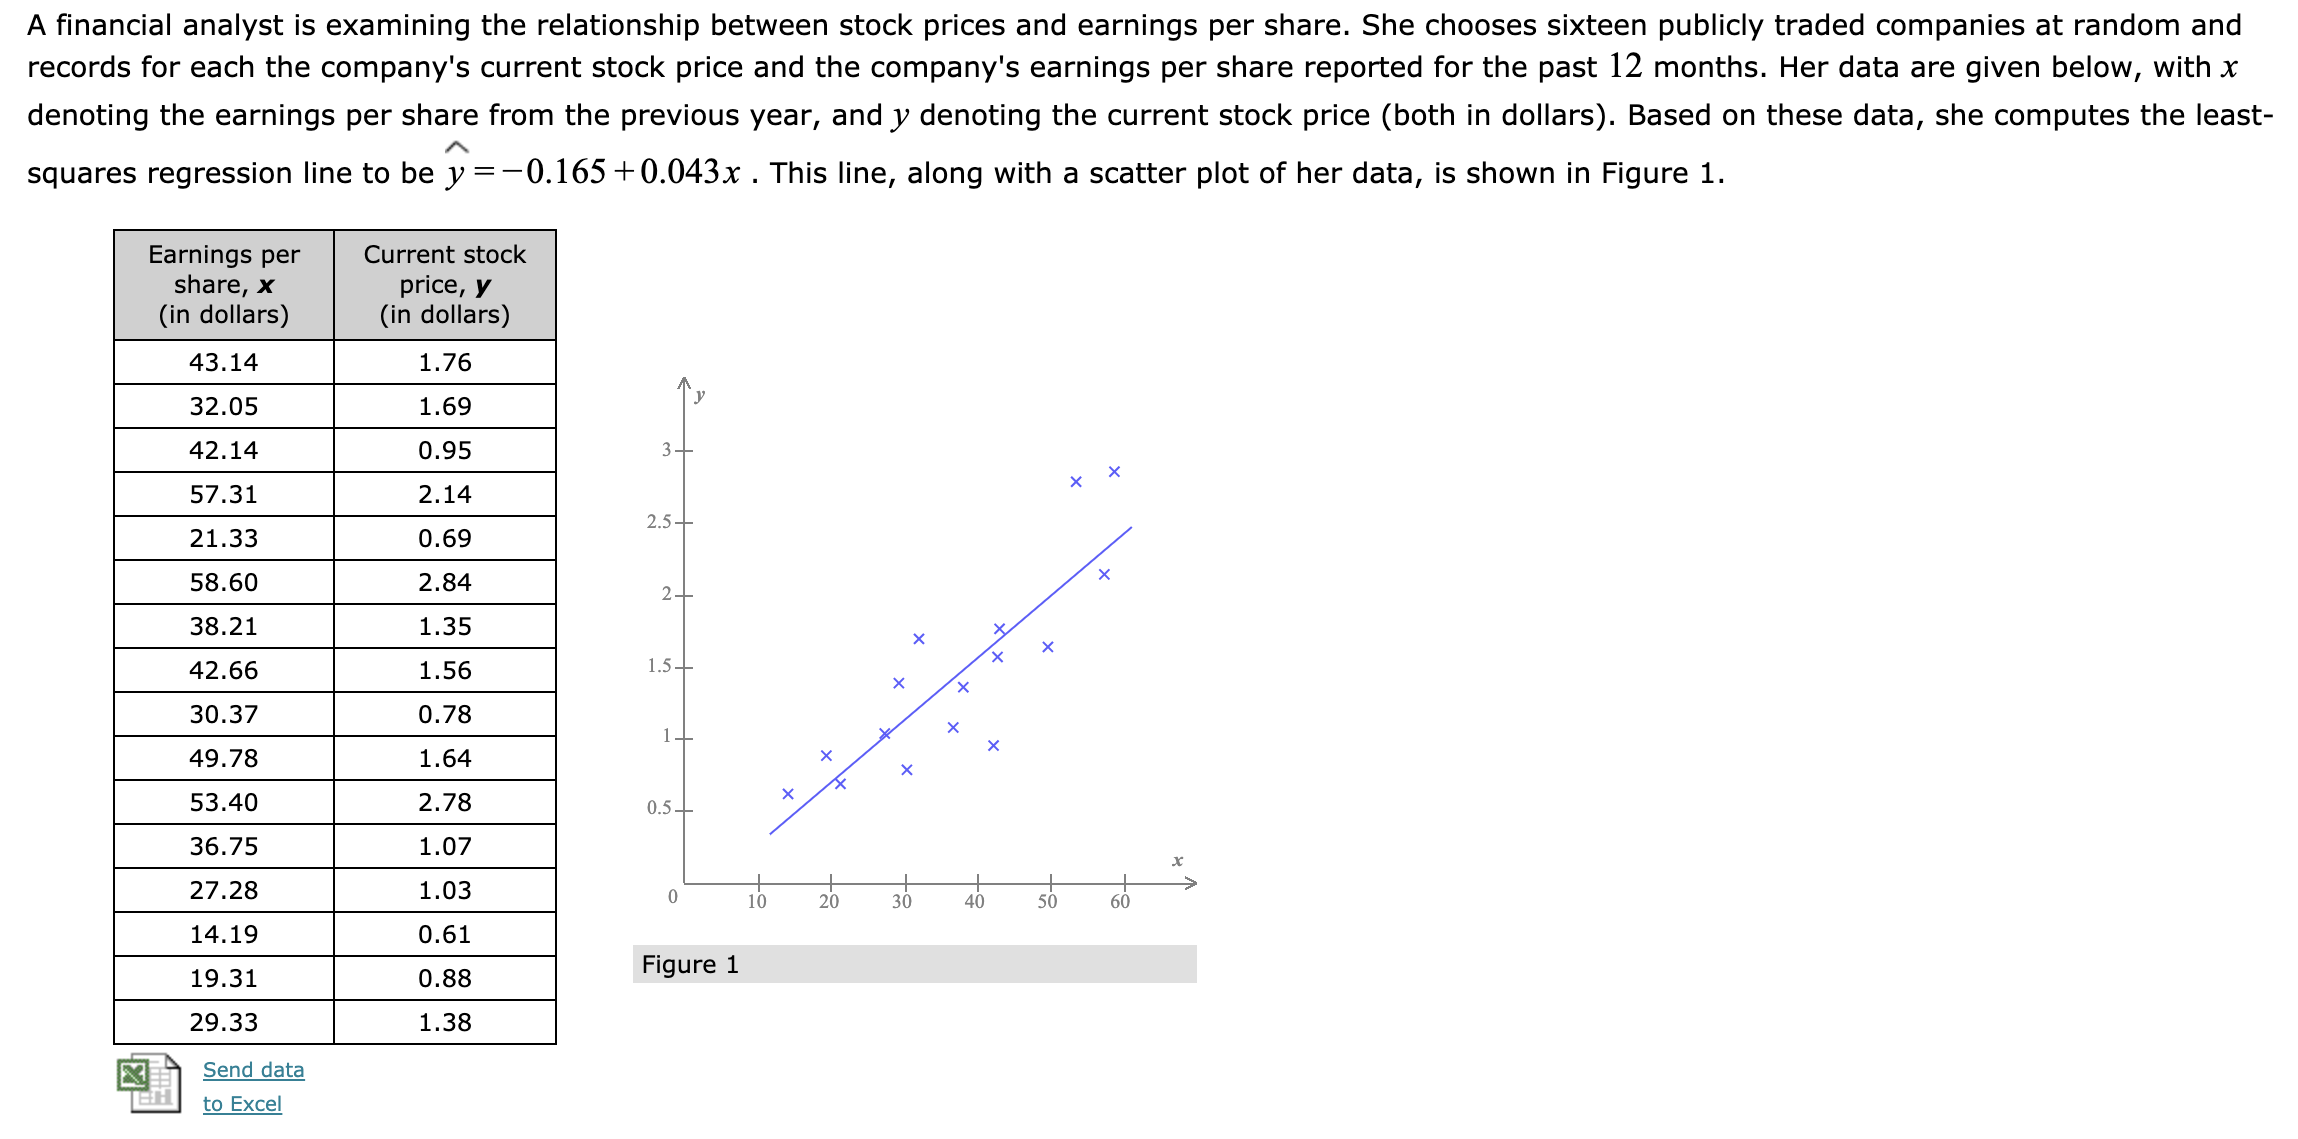
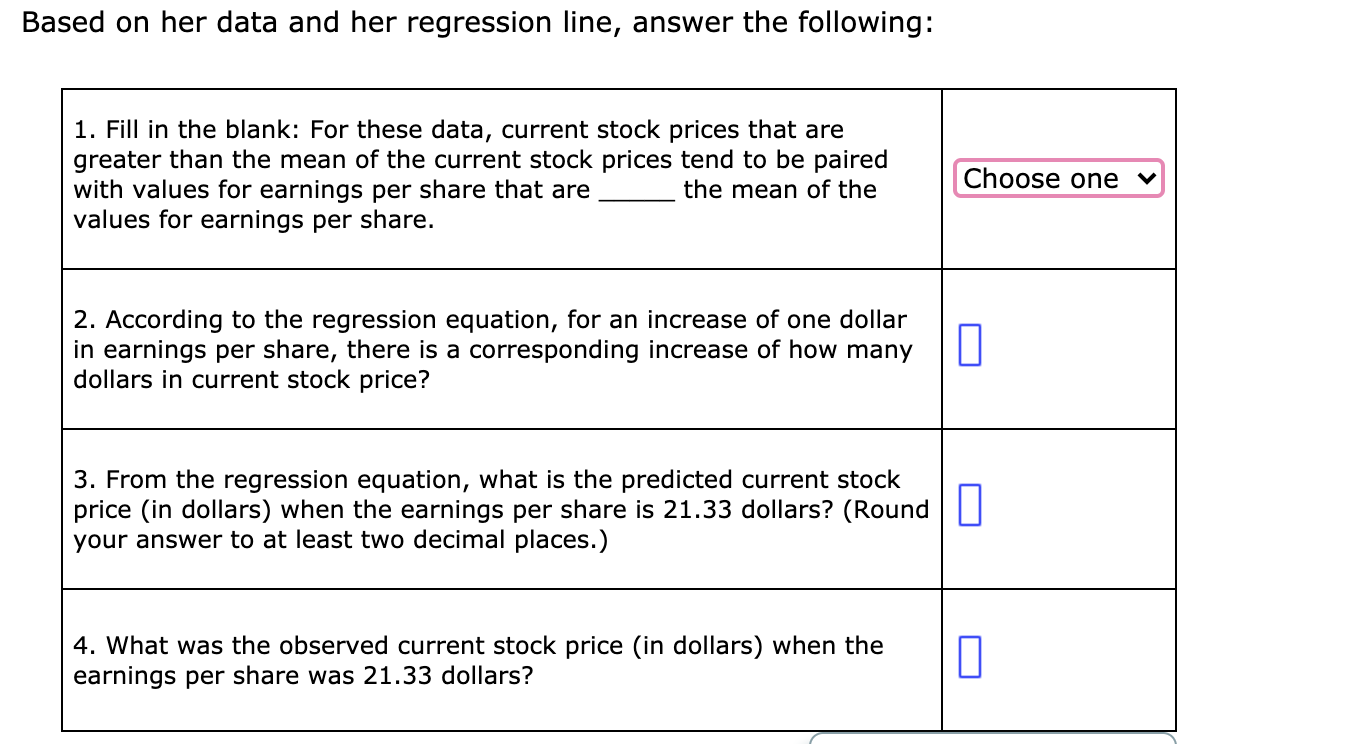
A nancial analyst is examining the relationship between stock prices and earnings per share. She chooses sixteen publicly traded companies at random and records for each the company's current stock price and the company's earnings per share reported for the past 12 months. Her data are given below, with x denoting the earnings per share from the previous year, and y denoting the current stock price (both in dollars). Based on these data, she computes the least- A squares regression line to be y =-0.165 +0.043x . This line, along with a scatter plot of her data, is shown in Figure 1. Earnings per Current stock share, x price, y (in dollars) (in dollars) 29.33 1.38 Ell Send data to Excel Based on her data and her regression line, answer the following: 1. Fill in the blank: For these data, current stock prices that are greater than the mean of the current stock prices tend to be paired with values for earnings per share that are the mean of the values for earnings per share. 2. According to the regression equation, for an increase of one dollar in earnings per share, there is a corresponding increase of how many dollars in current stock price? 4. What was the observed current stock price (in dollars) when the earnings per share was 21.33 dollars? 3. From the regression equation, what is the predicted current stock price (in dollars) when the earnings per share is 21.33 dollars? (Round your answer to at least two decimal places.)
Step by Step Solution
There are 3 Steps involved in it

Get step-by-step solutions from verified subject matter experts