

Question: I really am stuck on this one. Can you please work it so I can figure out where I've gone wrong? March 2020 Total 10C.
I really am stuck on this one. Can you please work it so I can figure out where I've gone wrong?
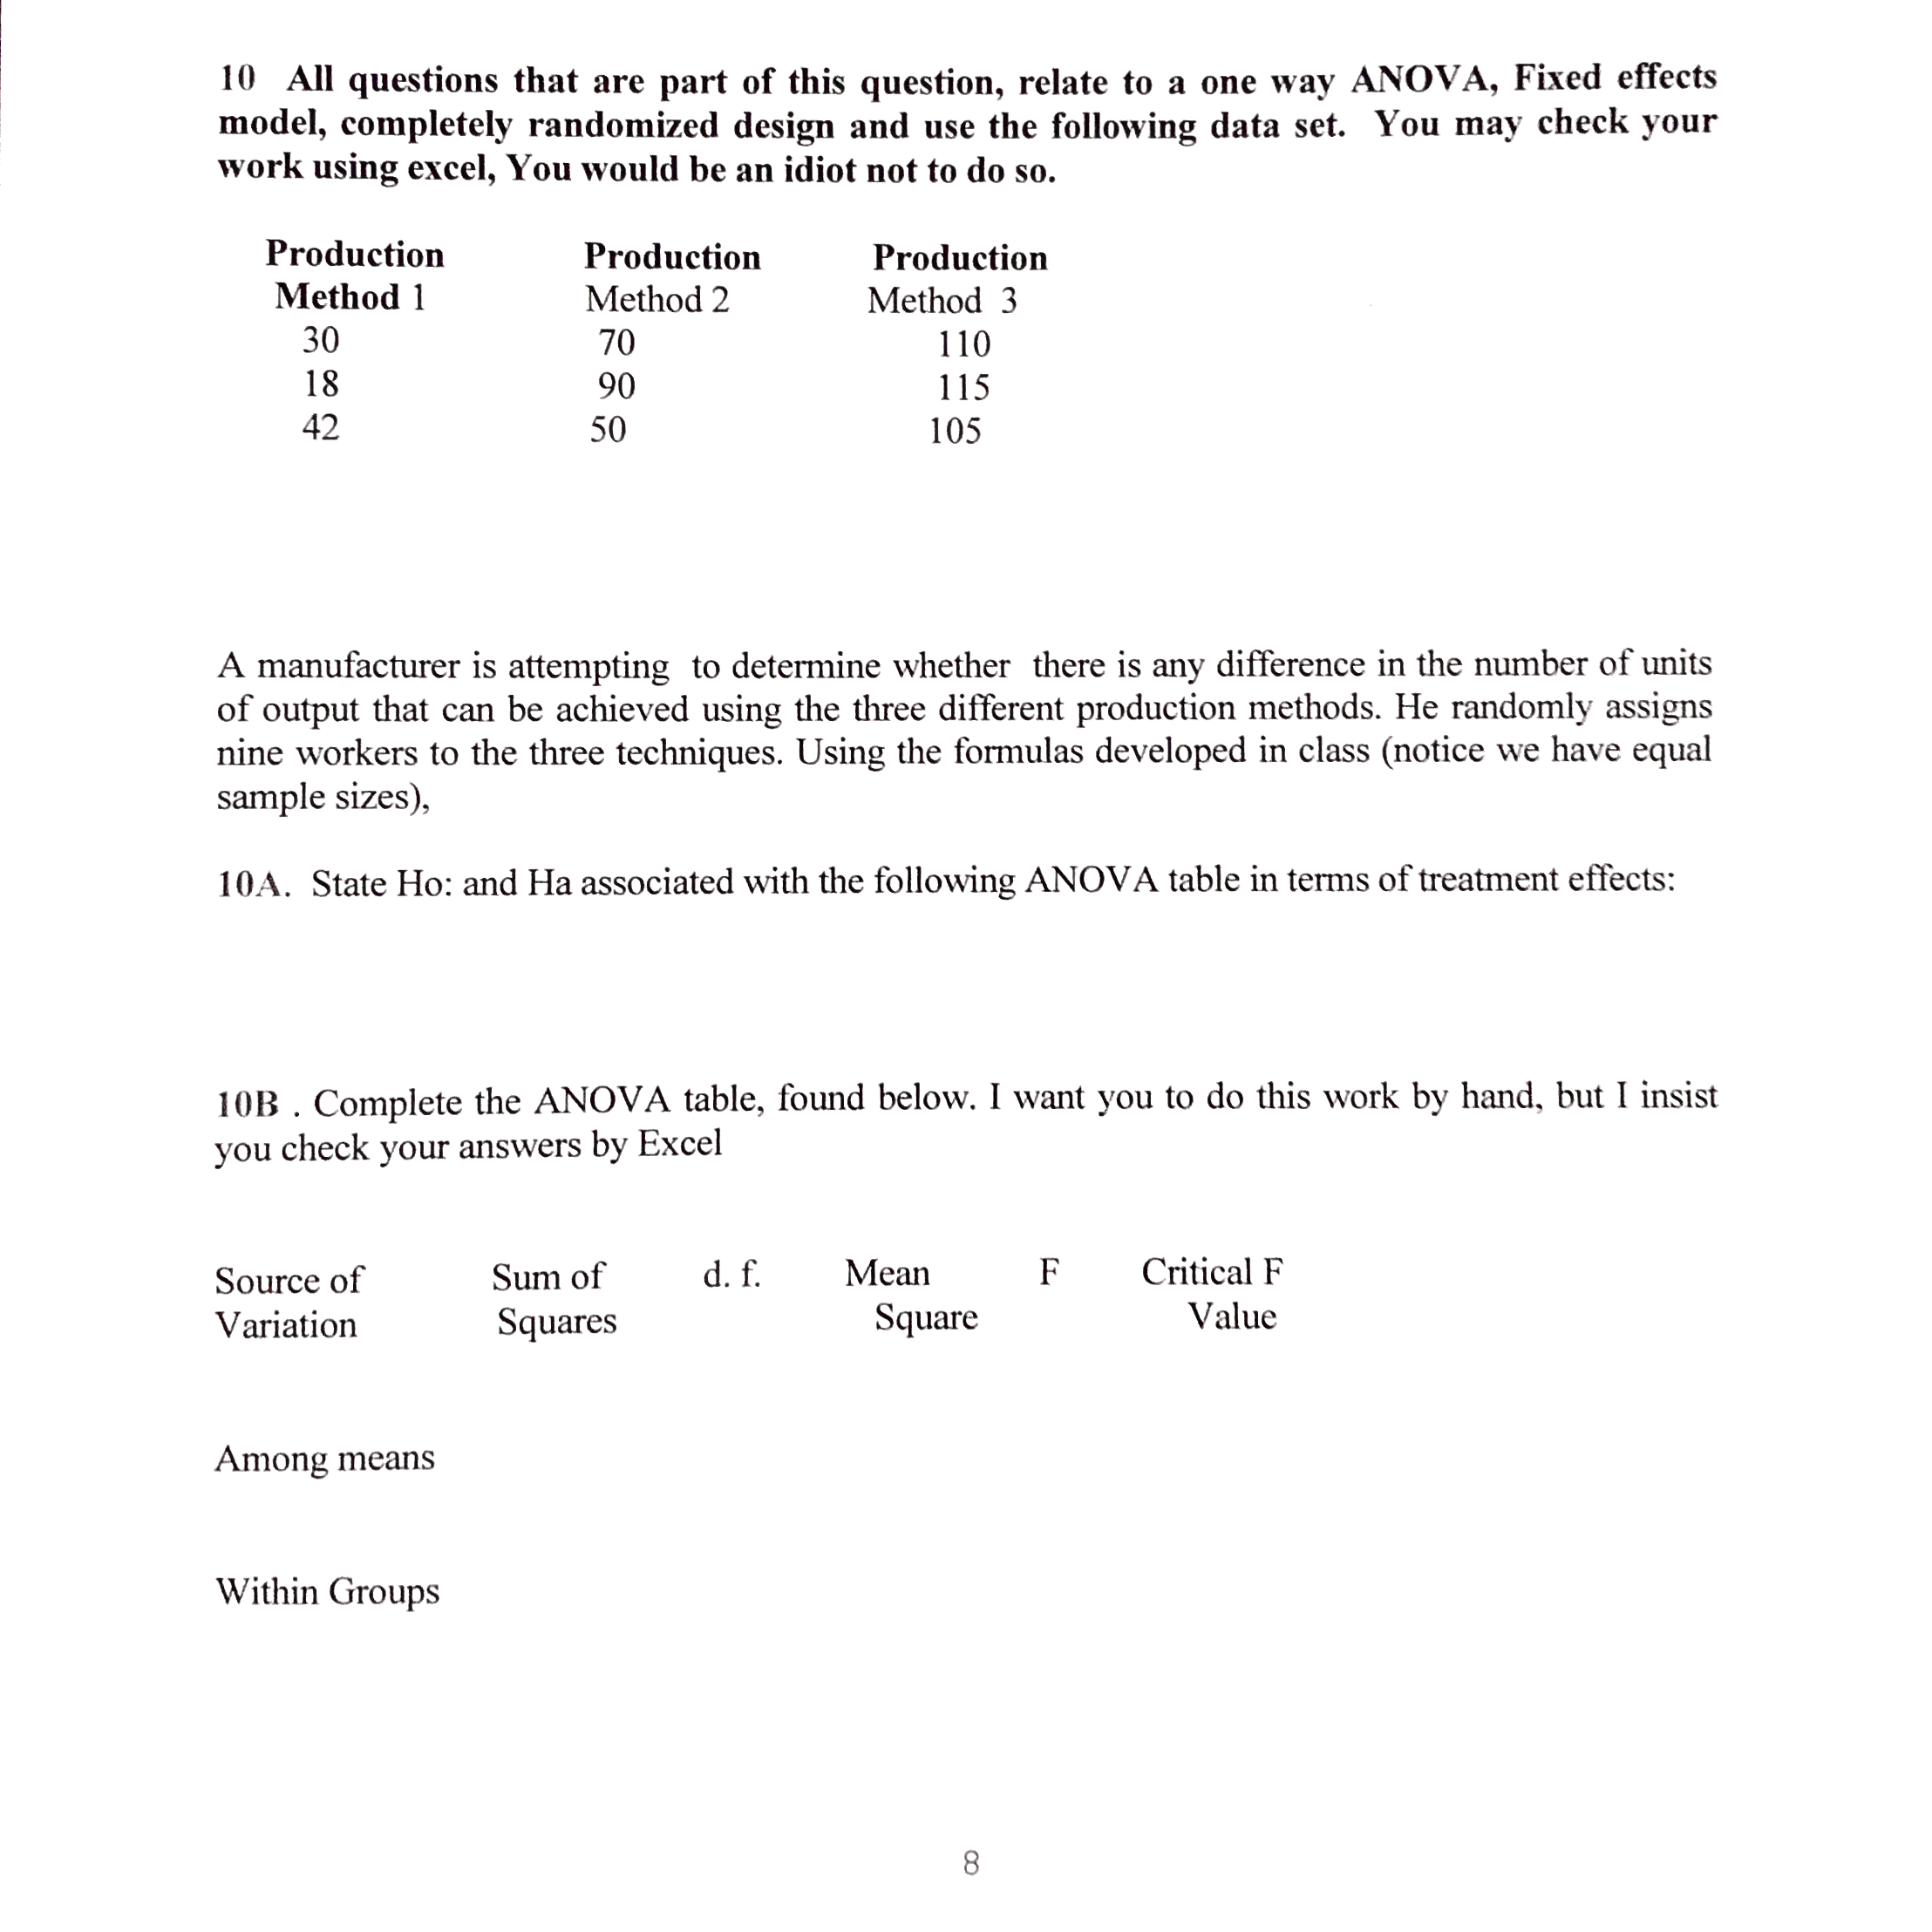
March 2020 Total 10C. Then i) compare the computed F to the critical F at alpha = 0.01, and come to the appropriate conclusion concerning the Null Hypothesis. Also ii) give me the p value associated with the computed F. 10 All questions that are part of this question, relate to a one way ANOVA, Fixed effects model, completely randomized design and use the following data set. You may check your work using excel, You would be an idiot not to do so. Production Production Production Method 1 Method 2 Method 3 30 70 110 18 90 1 15 42 50 105 A manufacturer is attempting to determine whether there is any difference in the number of imits of output that can be achieved using the three different production methods. He randomly assigns nine workers to the three techniques. Using the formulas developed in class (notice we have equal sample sizes), 10A. State Ho: and Ha associated with the following ANOVA table in terms of treatment e'ects: lOB . Complete the ANOVA table, found below. I want you to do this work by hand, but I insist you check your answers by Excel Source of Sum of d. f. Mean F Critical F Variation Squares Square Value Among means Within Groups
Step by Step Solution
There are 3 Steps involved in it

Get step-by-step solutions from verified subject matter experts