

Question: I really need help. Blue cells are data cells. Yellow cells are where I need to solve for the answer. Orange cells are informational cells
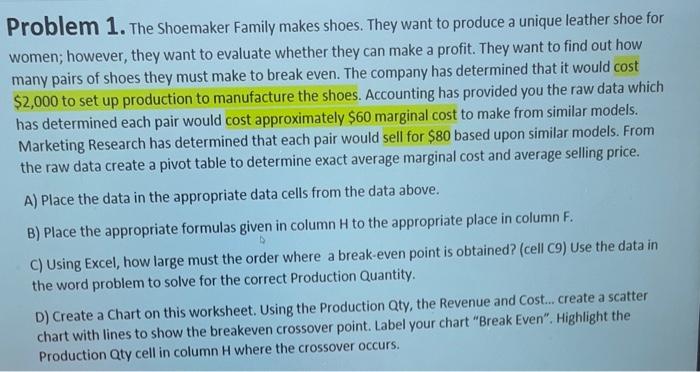
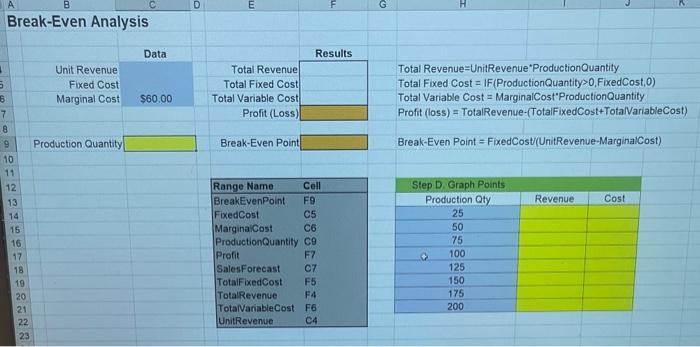
Problem 1. The shoemaker Family makes shoes. They want to produce a unique leather shoe for women; however, they want to evaluate whether they can make a profit. They want to find out how many pairs of shoes they must make to break even. The company has determined that it would cost $2,000 to set up production to manufacture the shoes. Accounting has provided you the raw data which has determined each pair would cost approximately $60 marginal cost to make from similar models. Marketing Research has determined that each pair would sell for $80 based upon similar models. From the raw data create a pivot table to determine exact average marginal cost and average selling price. A) Place the data in the appropriate data cells from the data above. B) Place the appropriate formulas given in column H to the appropriate place in column F. C) Using Excel, how large must the order where a break-even point is obtained? (cell c9) Use the data in the word problem to solve for the correct Production Quantity. D) Create a Chart on this worksheet. Using the Production Qty, the Revenue and Cost... create a scatter chart with lines to show the breakeven crossover point. Label your chart "Break Even". Highlight the Production Qty cell in column H where the crossover occurs. Break-Even Analysis \begin{tabular}{r|r|r|l|} & Data & Results \\ Unit Revenue & Total Revenue & \\ Fixed Cost & & Total Fixed Cost & \\ \hline Marginal Cost & $60.00 & Total Variable Cost & \\ & & Profit (Loss) & \\ \cline { 3 - 4 } & & \end{tabular} Total Revenue=UnitRevenue'ProductionQuantity Total Fixed Cost = IF(ProductionQuantity>0, FixedCost,0) Total Variable Cost = MarginalCost'ProductionQuantity Profit (loss) = TotalRevenue-(TotalFixedCost TotalVariableCost) Production Quantity Break-Even Point Break-Even Point = FixedCost(UnitRevenue-MarginalCost) \begin{tabular}{|ll|} \hline Range Name & Cell \\ \hline BreakEvenPoint & F9 \\ FixedCost & C5 \\ MarginalCost & C6 \\ ProductionQuantity & C9 \\ Preft & F7 \\ SalesForecast & C7 \\ TotalFixedCost & F5 \\ TotalRevenue & F4 \\ TotaiVariableCost & F6 \\ UnitRevenue & C4 \\ \hline \end{tabular} \begin{tabular}{|c|c|c|} \hline Step D. Graph Points & \\ \hline Production Qty & Revenue & Cost \\ \hline 25 & & \\ \hline 50 & & \\ \hline 75 & & \\ \hline 100 & & \\ \hline 125 & & \\ \hline 150 & & \\ \hline 175 & & \\ \hline 200 & & \\ \hline & & \\ \hline \end{tabular}
Step by Step Solution
There are 3 Steps involved in it

Get step-by-step solutions from verified subject matter experts