

Question: I really need help coming up with a 10 sentence memo regarding my problem below! (attached photos) Instructions: Write a memo to Lisa that identifies
I really need help coming up with a 10 sentence memo regarding my problem below! (attached photos) 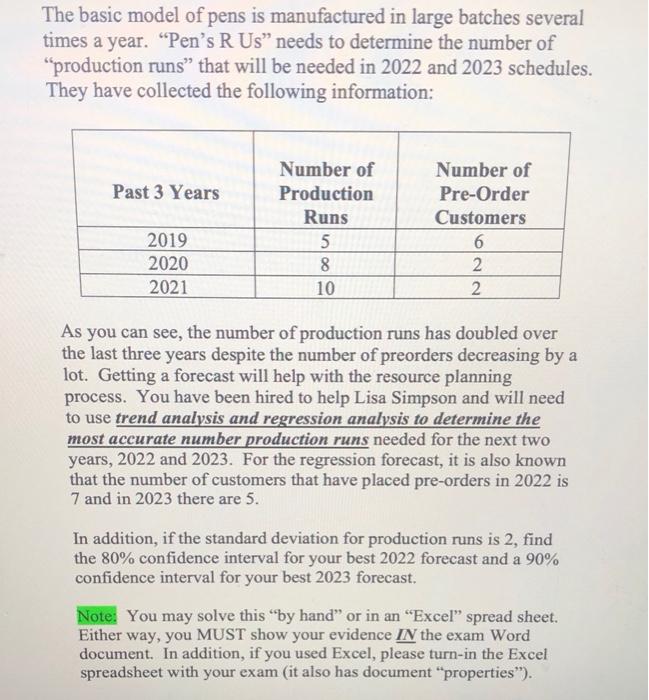
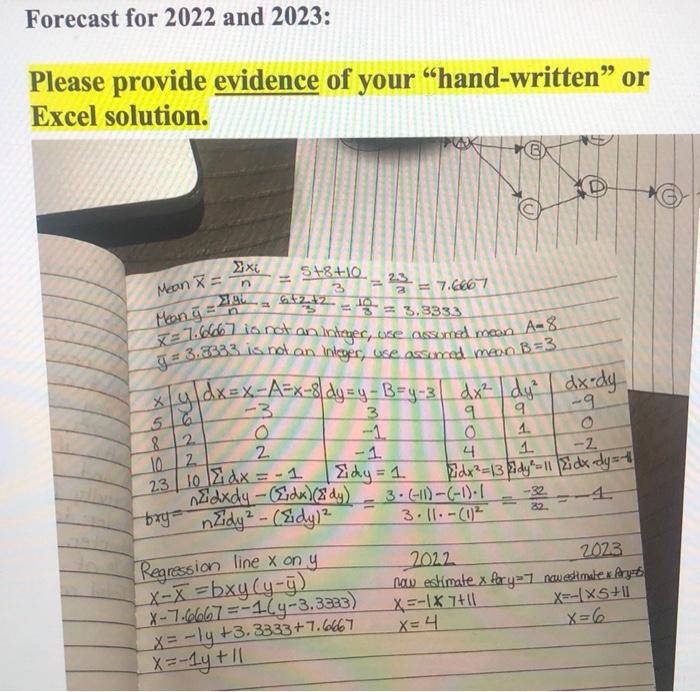
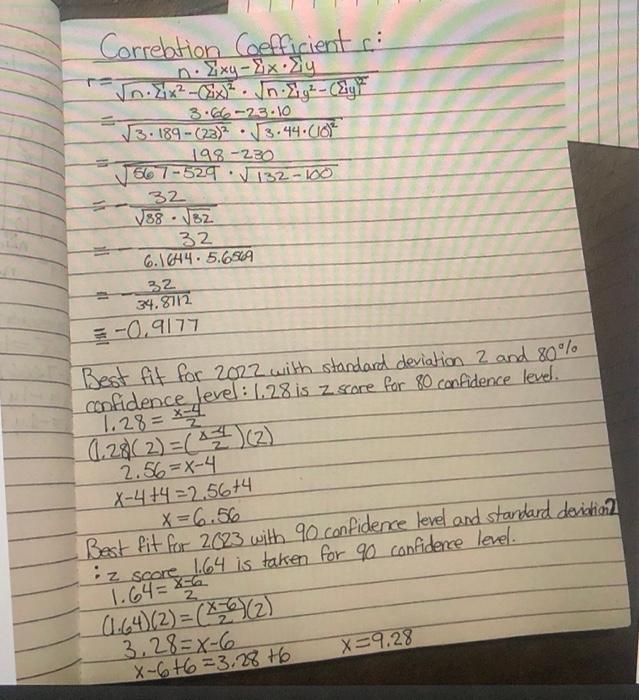
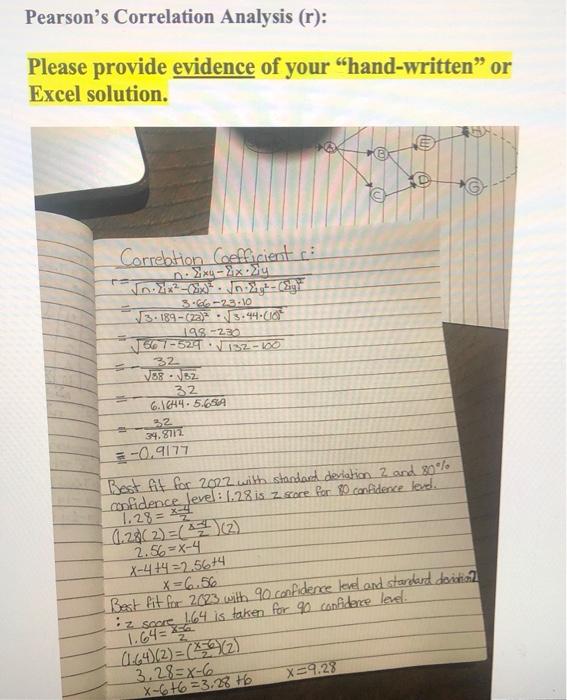
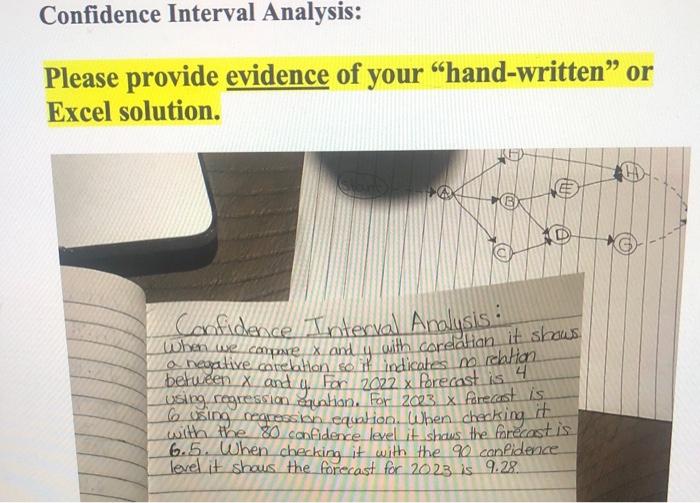
The basic model of pens is manufactured in large batches several times a year. Pen's R Us needs to determine the number of "production runs that will be needed in 2022 and 2023 schedules. They have collected the following information: Past 3 Years Number of Production Runs 5 8 10 Number of Pre-Order Customers 6 2 2 2019 2020 2021 As you can see, the number of production runs has doubled over the last three years despite the number of preorders decreasing by a lot. Getting a forecast will help with the resource planning process. You have been hired to help Lisa Simpson and will need to use trend analysis and regression analysis to determine the most accurate number production runs needed for the next two years, 2022 and 2023. For the regression forecast, it is also known that the number of customers that have placed pre-orders in 2022 is 7 and in 2023 there are 5. In addition, if the standard deviation for production runs is 2, find the 80% confidence interval for your best 2022 forecast and a 90% confidence interval for your best 2023 forecast, Note: You may solve this by hand or in an Excel spread sheet. Either way, you MUST show your evidence IN the exam Word document. In addition, if you used Excel, please turn-in the Excel spreadsheet with your exam (it also has document "properties"). Forecast for 2022 and 2023: Please provide evidence of your "hand-written or Excel solution. D U S8+ , n 19 3 Meon = Meong 23. = 7.6667 - 6*2*2 = 1 = 3.3333 31.66667 is not an Integer, use assumed mean A-8 y 3.2833 is not an Inleger, use assunced meo B=3 56 -3 3 9 9 -9 & 2 0 1 o 10. 2 2 -1 4 1 -2 2310 dx = -1 Edy = 1 Edx=13 dy = 11 zidx dy=1 idxdy -(Endx(dy) 3.611)-(-1)-1 -32 bry nzidy - (Eidy) 3.11.-(1)2 Regression line x on y X-X =bxy(y-5) X-7.6667=-164-3.3333) X= -19 +3.38337.667 X=-17 + Il 2022 2023 now eskimale x faya7 nowegimidex forys X=-1X 7710 X=-1X5+11 X=4 x=6 11 Correlation coefficient ri n Exy Xxsly Vn.Xx2 --Cix. Vn.Xyl-(y* 3.66 -23.10 3.189 - (22/2 3.44 Cote 198-220 1567-529132-100 32 V88. VBZ 32 6.164.5.6649 11 = 32 34.8712 -0.9177 Best fit for 2022 with standard deviation 2 and 80% confidence level: 1.28 is z score for 80 confidence level. 1.28 = x-4 1.28(2)=(x 2 ) (2) 2.56 =X-4 X-4+4 =2.5674 X=6.56 Best fit for 2023 with 90. confidence level and standard devichar iz score 1.64 is taken for 90 confidence level. 1.64=8-6 (1.64)(2)=(x-6) (2) 3.28=8-6 X-6+6=3.28 +6 x=9.28 z Pearson's Correlation Analysis (r): Please provide evidence of your "hand-written" or Excel solution. ( 10 Corretion Coefficients . - . 3.6 23:10 3:189 - (23 13.44-010 192230 1667-529132-100 32 138.62 32 6.1644.5.654 32 34.8112 -0.9177 Best fit for 2022 with standard deviation 2 and 80% confidence level: 1.28is 2 core for confidence loud 1.28=x-2 0.28(2)=( 14 (2) 2.56=x-4 X-4+4 = 2.56+4 X=6.52 Best fit for 2023 with 90.confidence level and standard dicta iz score 1.64 is taken for 90 confidence level. 1.64 = x2 01.64)(2) = (x0)(2) 3.28=8-6 X-6 +6 =3.2816 X=9.28 Confidence Interval Analysis: Please provide evidence of your "hand-written or Excel solution. uur 5 e lo fo with coreldrian it shows Confidence Interval Analysis: When we copie x and o negative corelation of indicates no rektion between X and y. For 2022 x Porecast is 4 using regression Squation. For 2023 X forecast is 6 using regression equation. When checking it with the 80 confidence level it shows the forecast is 6.5. When checking it with the 90 confidence level it shous the forecast for 2023.is 9.28 Instructions:
Write a memo to Lisa that identifies the best forecasting method and your best forecasts for the number of production runs needed in 2022 and 2023. In addition, suggest a TWO qualitative model that could be used to enhance the forecasting process.
The memo must have at least 10 GREAT sentences of with your opinions, decision, and your reasons why.
Step by Step Solution
There are 3 Steps involved in it
1 Expert Approved Answer
Step: 1 Unlock

Question Has Been Solved by an Expert!
Get step-by-step solutions from verified subject matter experts
Step: 2 Unlock
Step: 3 Unlock