

Question: I really need help with 1 and 2, I'm not sure I'm doing it right! DATA TABLE DATA ANALYSIS 1. The P. for Trials 15
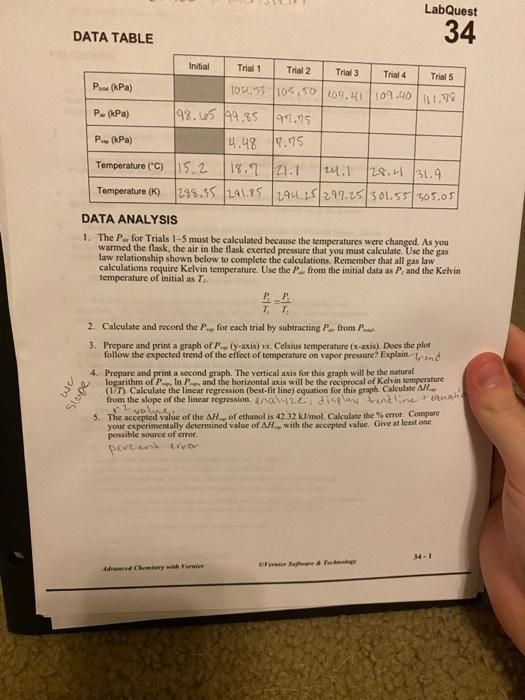
DATA TABLE DATA ANALYSIS 1. The P. for Trials 15 must be calculated because the temperatures were changed. As you warmed the flask, the air in the flask exerted pressure that you must calculate. Use the gas law relationship shown below to complete the calculations. Remember that all gas law calculations require Kelvin temperature. Use the P, from the initial data as Pr and the Kelvin temperature of taitial as Ts. T1P1=T3P1 3. Prepare and print a graph of P-(Y-axis) vs. Celshus temperature (x-axis). Does the plot follow the expected trend of the elfoct of temperanare on vapor preasare? Explain. Tr thd 4. Prepare and print a second graph. The vertical axis for this graph will be the natural logarithm of P2,lnP and ahe horizontal axis will be the reciprecal of Kelvin teniperature (1in. Calculate the lincar regression (best-fit line) equation for this graph. Calculate H, from the slope of the linear regression, and 12C, display trencline tequat your experimentally determined value of H, with the accepted value. Give at leat one possible source of error. pertent crubr DATA TABLE DATA ANALYSIS 1. The P. for Trials 15 must be calculated because the temperatures were changed. As you warmed the flask, the air in the flask exerted pressure that you must calculate. Use the gas law relationship shown below to complete the calculations. Remember that all gas law calculations require Kelvin temperature. Use the P, from the initial data as Pr and the Kelvin temperature of taitial as Ts. T1P1=T3P1 3. Prepare and print a graph of P-(Y-axis) vs. Celshus temperature (x-axis). Does the plot follow the expected trend of the elfoct of temperanare on vapor preasare? Explain. Tr thd 4. Prepare and print a second graph. The vertical axis for this graph will be the natural logarithm of P2,lnP and ahe horizontal axis will be the reciprecal of Kelvin teniperature (1in. Calculate the lincar regression (best-fit line) equation for this graph. Calculate H, from the slope of the linear regression, and 12C, display trencline tequat your experimentally determined value of H, with the accepted value. Give at leat one possible source of error. pertent crubr
Step by Step Solution
There are 3 Steps involved in it

Get step-by-step solutions from verified subject matter experts