Question: I really need help with question 3&4 Please show formulas and answers. Thank you A B C D E F G 4. Create projected statements
I really need help with question 3&4
Please show formulas and answers. Thank you
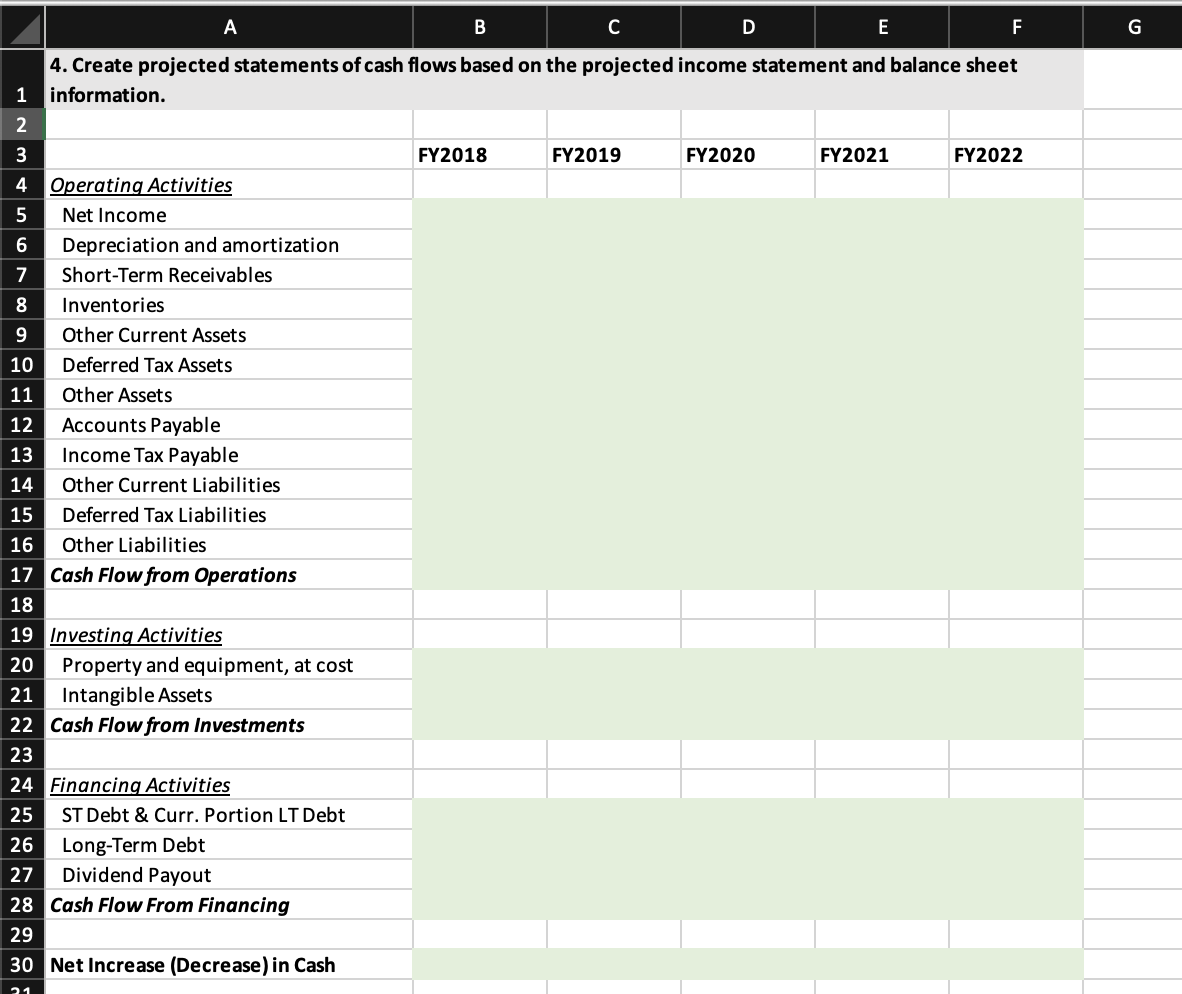
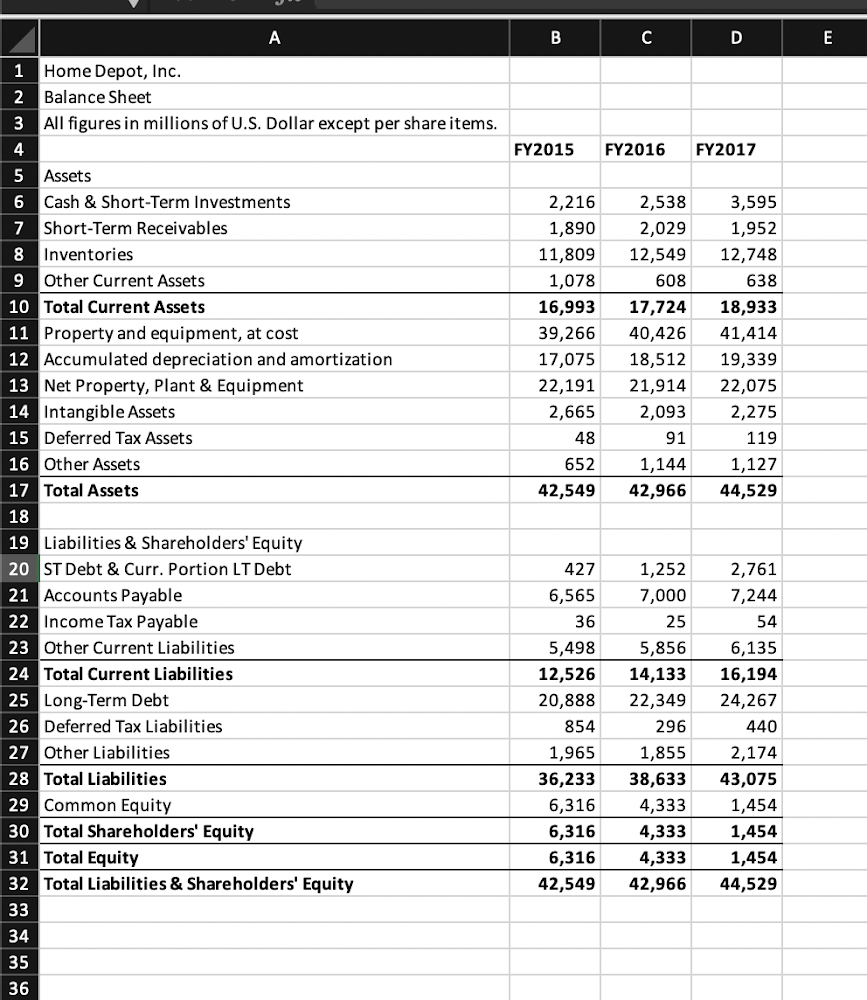
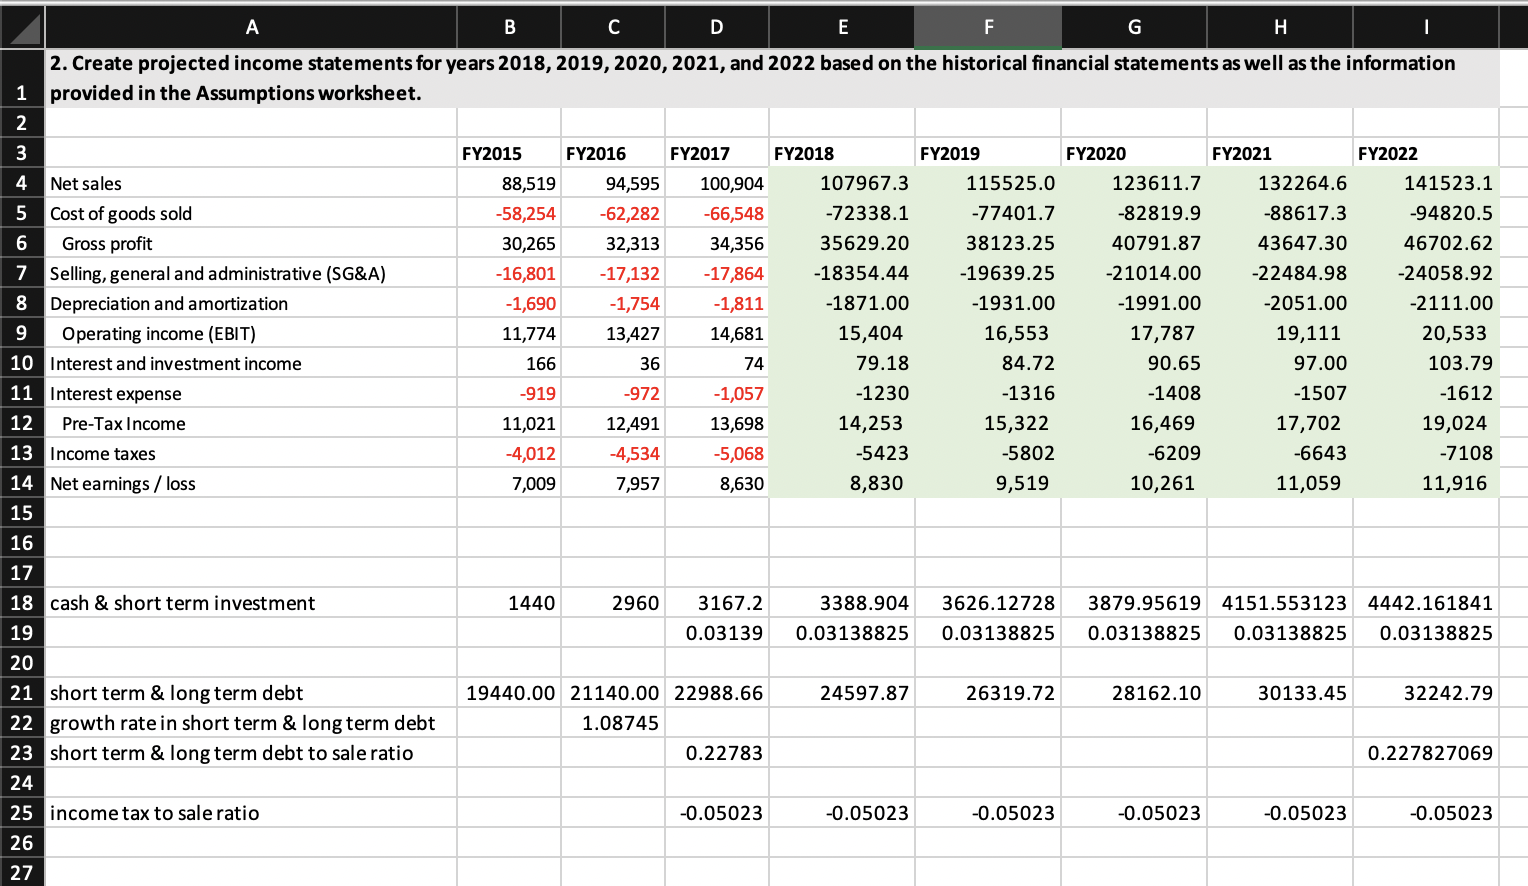
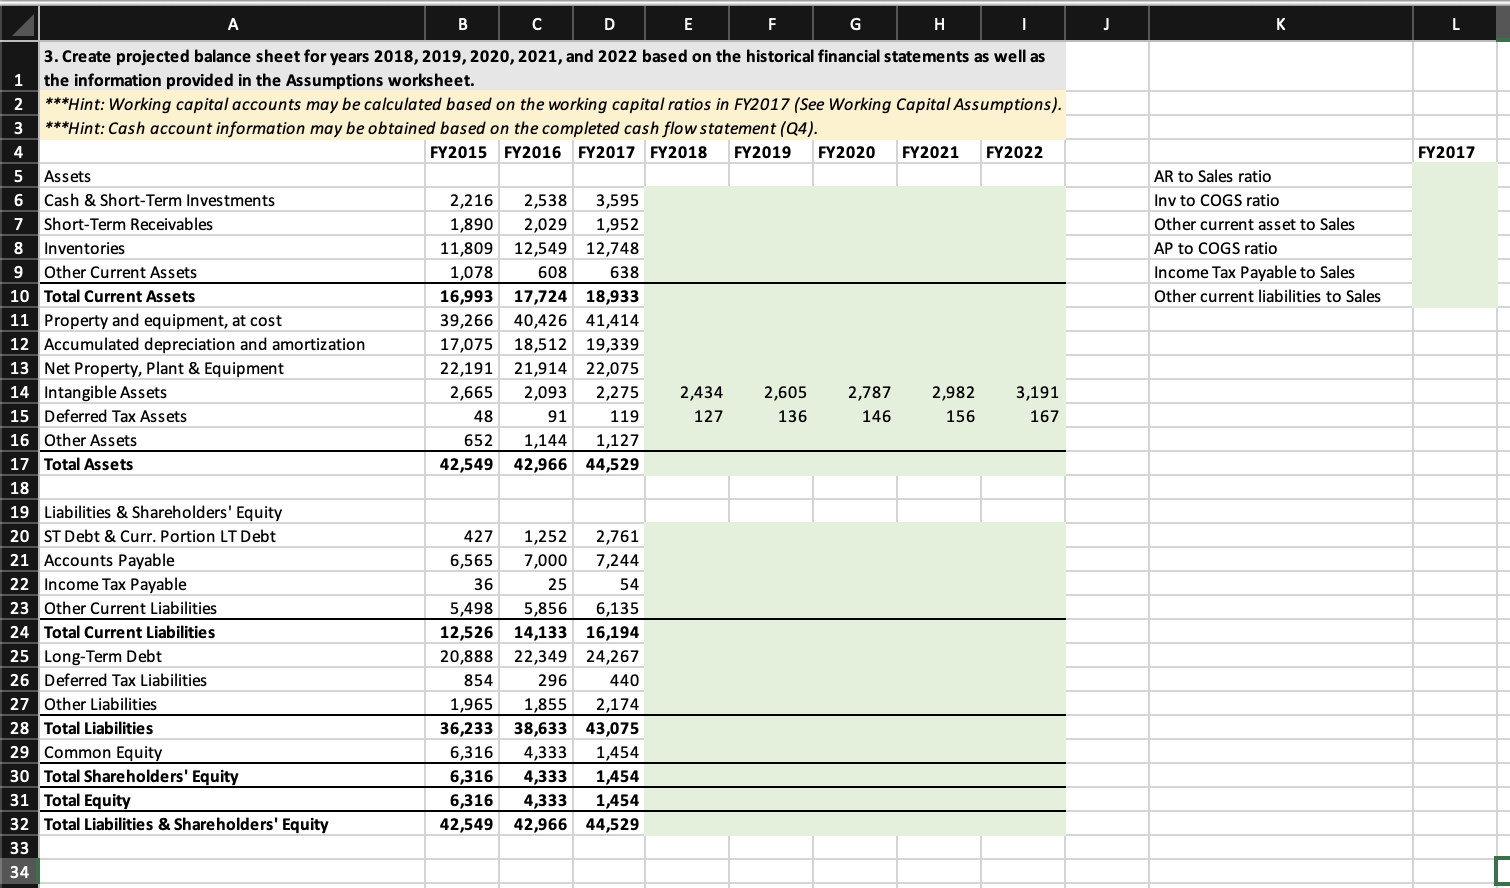
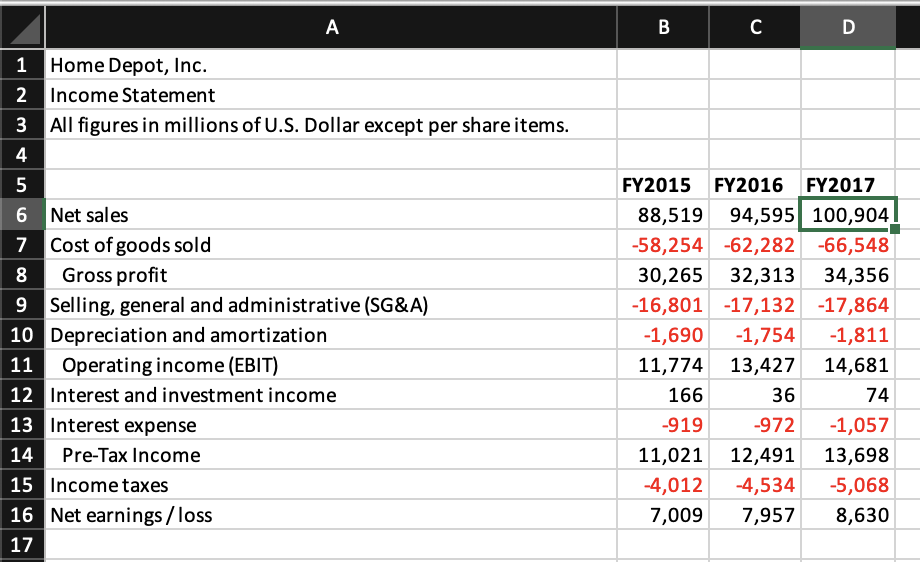
A B C D E F G 4. Create projected statements of cash flows based on the projected income statement and balance sheet 1 information. W N FY2018 FY2019 FY2020 FY2021 FY2022 A Operating Activities Net Income Depreciation and amortization Short-Term Receivables Inventories Other Current Assets 10 Deferred Tax Assets 11 Other Assets 12 Accounts Payable 13 Income Tax Payable 14 Other Current Liabilities 15 Deferred Tax Liabilities 16 Other Liabilities 17 Cash Flow from Operations BT 19 Investing Activities 20 Property and equipment, at cost 21 Intangible Assets 22 Cash Flow from Investments 23 24 Financing Activities 25 ST Debt & Curr. Portion LT Debt 26 Long-Term Debt 27 Dividend Payout 28 Cash Flow From Financing 29 30 Net Increase (Decrease) in CashA B C D E P Home Depot, Inc. Balance Sheet W N All figures in millions of U.S. Dollar except per share items. .A FY2015 FY2016 FY2017 Assets Cash & Short-Term Investments 2,216 2,538 3,595 Short-Term Receivables 1,890 2,029 1,952 00 Inventories 11,809 12,549 12,748 9 Other Current Assets 1,078 608 638 10 Total Current Assets 16,993 17,724 18,933 11 Property and equipment, at cost 39,266 40,426 41,414 12 Accumulated depreciation and amortization 17,075 18,512 19,339 13 Net Property, Plant & Equipment 22,191 21,914 22,075 14 Intangible Assets 2,665 2,093 2,275 15 Deferred Tax Assets 48 91 119 16 Other Assets 652 1,144 1,127 17 Total Assets 42,549 42,966 44,529 BT 19 Liabilities & Shareholders' Equity 20 ST Debt & Curr. Portion LT Debt 427 1,252 2,761 21 Accounts Payable 6,565 7,000 7,244 22 Income Tax Payable 36 25 54 23 Other Current Liabilities 5,498 5,856 6,135 24 Total Current Liabilities 12,526 14,133 16,194 25 Long-Term Debt 20,888 22,349 24,267 26 Deferred Tax Liabilities 854 296 440 27 Other Liabilities 1,965 1,855 2,174 28 Total Liabilities 36,233 38,633 43,075 29 Common Equity 6,316 4,333 1,454 30 Total Shareholders' Equity 6,316 4,333 1,454 31 Total Equity 6,316 1,333 1,454 32 Total Liabilities & Shareholders' Equity 42,549 42,966 44,529 33 34 35 36A B C D E F G H 2. Create projected income statements for years 2018, 2019, 2020, 2021, and 2022 based on the historical financial statements as well as the information provided in the Assumptions worksheet. 3 FY2015 FY2016 FY2017 FY2018 FY2019 FY2020 FY2021 FY2022 4 Net sales 88,519 94,595 100,904 107967.3 115525.0 123611.7 132264.6 141523.1 5 Cost of goods sold -58,254 -62,282 -66,548 -72338.1 -77401.7 -82819.9 -88617.3 -94820.5 6 Gross profit 30,265 32,313 34,356 35629.20 38123.25 40791.87 43647.30 46702.62 Selling, general and administrative (SG&A) -16,801 -17,132 -17,864 -18354.44 -19639.25 -21014.00 -22484.98 -24058.92 8 Depreciation and amortization -1,690 -1,754 -1,811 -1871.00 -1931.00 -1991.00 -2051.00 -2111.00 9 Operating income (EBIT) 11,774 13,427 14,681 15,404 16,553 17,787 19,111 20,533 10 Interest and investment income 166 36 74 79.18 84.72 90.65 97.00 103.79 11 Interest expense -919 -972 -1,057 -1230 -1316 -1408 -1507 -1612 12 Pre-Tax Income 11,021 12,491 13,698 14,253 15,322 16,469 17,702 19,024 13 Income taxes -4,012 -4,534 -5,068 -5423 -5802 6209 -6643 -7108 14 Net earnings / loss 7,009 7,957 8,630 8,830 9,519 10,261 11,059 11,916 15 16 17 18 cash & short term investment 1440 2960 3167.2 3388.904 3626.12728 3879.95619 4151.553123 4442.161841 19 0.03139 0.03138825 0.03138825 0.03138825 0.03138825 0.03138825 20 21 short term & long term debt 19440.00 21140.00 22988.66 24597.87 26319.72 28162.10 30133.45 32242.79 22 growth rate in short term & long term debt 1.08745 23 short term & long term debt to sale ratio 0.22783 0.227827069 24 25 income tax to sale ratio -0.05023 -0.05023 -0.05023 -0.05023 -0.05023 -0.05023 26 27B C D E F G H K 3. Create projected balance sheet for years 2018, 2019, 2020, 2021, and 2022 based on the historical financial statements as well as the information provided in the Assumptions worksheet. ***Hint: Working capital accounts may be calculated based on the working capital ratios in FY2017 (See Working Capital Assumptions). W ***Hint: Cash account information may be obtained based on the completed cash flow statement (Q4). FY2015 FY2016 FY2017 FY2018 FY2019 FY2020 FY2021 FY2022 FY2017 5 Assets AR to Sales ratio 6 Cash & Short-Term Investments 2,216 2,538 3,595 Inv to COGS ratio Short-Term Receivables 1,890 2,029 1,952 Other current asset to Sales 8 Inventories 11,809 12,549 12,748 AP to COGS ratio 9 Other Current Assets 1,078 608 638 Income Tax Payable to Sales 10 Total Current Assets 16,993 17,724 18,933 Other current liabilities to Sales 11 Property and equipment, at cost 39,266 40,426 41,414 12 Accumulated depreciation and amortization 17,075 18,512 19,339 13 Net Property, Plant & Equipment 22,191 21,914 22,075 14 Intangible Assets 2,665 2,093 2,275 2,434 2,605 2,787 2,982 3,191 15 Deferred Tax Assets 48 91 119 127 136 146 156 167 16 Other Assets 652 1,144 1,127 17 Total Assets 42,549 42,966 44,529 18 19 Liabilities & Shareholders' Equity 20 ST Debt & Curr. Portion LT Debt 427 1,252 2,761 21 Accounts Payable 6,565 7,000 7,244 22 Income Tax Payable 36 25 54 23 Other Current Liabilities 5,498 5,856 6,135 24 Total Current Liabilities 12,526 14,133 16,194 25 Long-Term Debt 20,888 22,349 24,267 26 Deferred Tax Liabilities 854 296 440 27 Other Liabilities 1,965 1,855 2,174 28 Total Liabilities 36,233 38,633 43,075 29 Common Equity 6,316 4,333 1,454 30 Total Shareholders' Equity 6,316 4,333 1,454 31 Total Equity 5,316 4,333 1,454 32 Total Liabilities & Shareholders' Equity 42,549 42,966 44,529 33 34B C D E F G H K Operating Assumptions: Sales will grow at 7% per year in the next 5 years. w Cost of sales will be 67% of total sales in the next 5 years. SG&A will be 17% of total sales in the next 5 years. Annual Depreciation and Amortization increases by 60 in each of the next 5 years. Capital expenditure (CapEx) will be 1,200 in each of the next 5 years. Income Statement Assumptions: LD 00 Interest and investment income is 2.5% of the ending Cash & Short-Term Investments in the previous year. 10 Interest rate on debt is 5% based on the ending ST Debt & Curr. Portion LT Debt and Long-Term Debt in the previous year. 11 Tax rate is assumed to be 21%. 12 1, 184 million common shares outstanding. 13 Dividend payout ratio = 50% 14 15 Working Capital Assumptions 16 In the next 5 years, AR to Sales ratio remains the same as that in the most recent fiscal year (FY2017). 17 In the next 5 years, Inventory to COGS ratio remains the same as that in the most recent fiscal year (FY2017). 18 In the next 5 years, Other current assets to Sales ratio remains the same as that in the most recent fiscal year (FY2017). 19 In the next 5 years, AP to COGS ratio remains the same as that in the most recent fiscal year (FY2017). In the next 5 years, Income Tax Payable to Sales ratio remains the same as that in the most recent fiscal year (FY2017). 21 In the next 5 years, Other current liabilities to Sales ratio remains the same as that in the most recent fiscal year (FY2017). 22 23 Assets Assumptions: 24 Intangible assets grows at the same rate as sales (7%) in the next 5 years 25 Deferred tax assets grows at the same rate as sales (7%) in the next 5 years 26 Other assets grows at the same rate as sales (7%) in the next 5 years 27 Deferred tax liabilities grows at the same rate as sales (7%) in the next 5 years 28 Other liabilities grows at the same rate as sales (7%) in the next 5 years 29 30 Debt Assumptions 31 Short-term debt increases by 2% in each year. 32 Long-term debt decreases by 8% each year. 33 34 Valuation Assumptions 35 Future annual cash flow from assets (CFFA) growth rate (beyond 2022) is assumed to be 5%. 36 Weighted average cost of capital (WACC) is 9%.A B C D 1 Home Depot, Inc. 2 Income Statement All figures in millions of U.S. Dollar except per share items. 4 5 FY2015 FY2016 FY2017 6 Net sales 88,519 94,595 100,904 7 Cost of goods sold -58,254 -62,282 -66,548 8 Gross profit 30,265 32,313 34,356 9 Selling, general and administrative (SG&A) -16,801 -17,132 -17,864 10 Depreciation and amortization -1,690 -1,754 -1,811 11 Operating income (EBIT) 11,774 13,427 14,681 12 Interest and investment income 166 36 74 13 Interest expense -919 -972 -1,057 14 Pre-Tax Income 11,021 12,491 13,698 15 Income taxes -4,012 -4,534 -5,068 16 Net earnings / loss 7,009 7,957 8,630 17A B C D 1. Calculate the following measures for fiscal years 2015, 2016, and 2017: (1) profit margin, (2) ROA, (3) ROE, (4) debt-to-equity ratio, (5) accounts receivable days, (6) days inventory outstanding, (7) 1 accounts payable days. 2 FY2015 FY2016 FY2017 3 Profit margin 7.92 8.41 8.55 4 ROA 16.47 18.52 19.38 5 ROE 110.97 183.64 593.54 6 Debt-to-equity ratio 5.74 8.92 29.63 7 Accoutns receivable days 8 8 8 Days inventory outstanding -74 -71 -69 9 Accounts payable days -41 -40 -39 10 11 12