

Question: I really need help with this problem, I got stuck at the EBITDA coverage question. Please explain where numbers come from, thanks so much! sinking
I really need help with this problem, I got stuck at the EBITDA coverage question. Please explain where numbers come from, thanks so much!
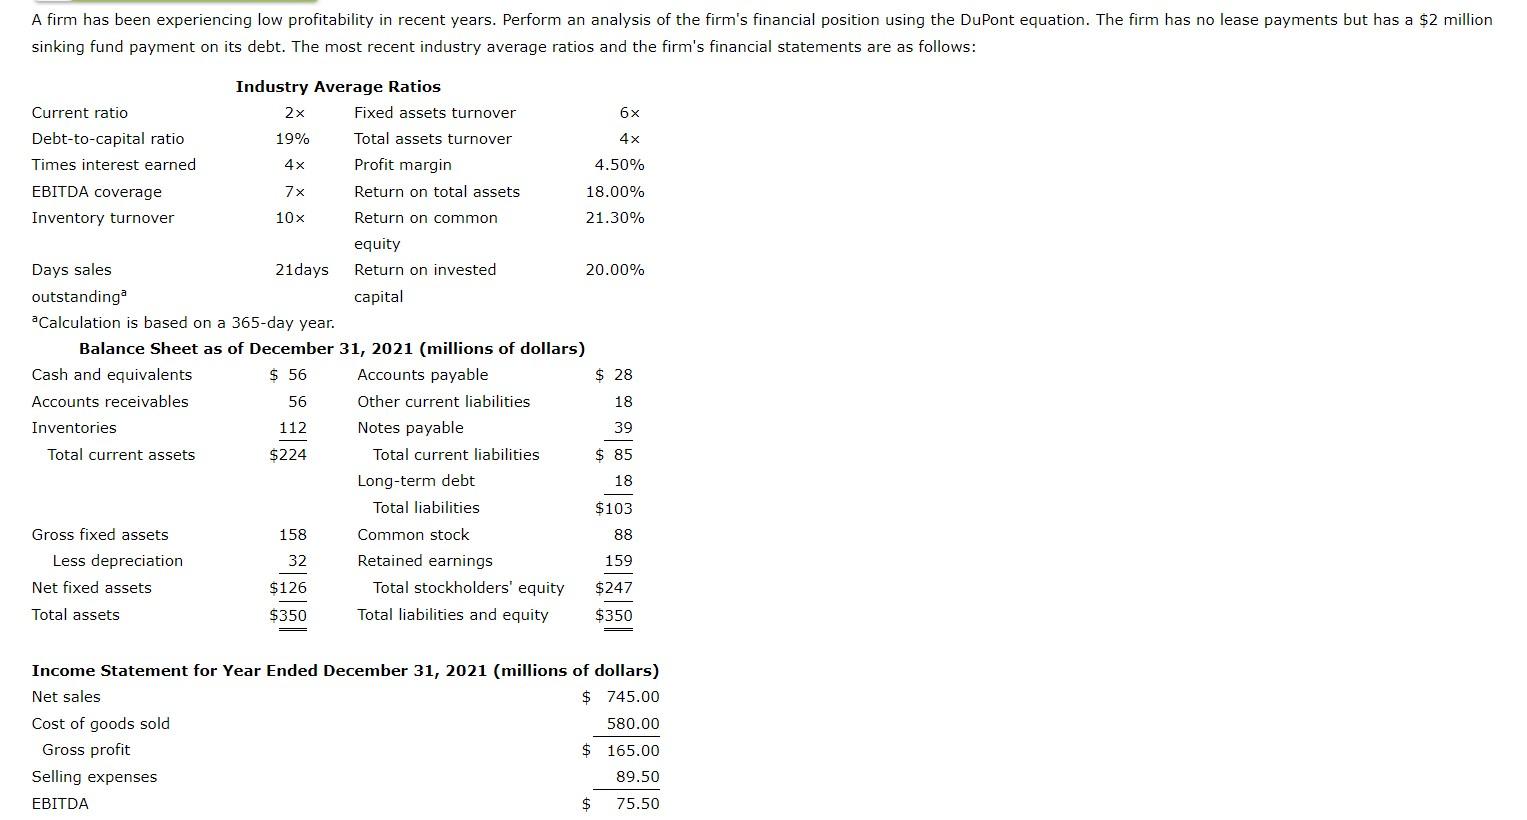
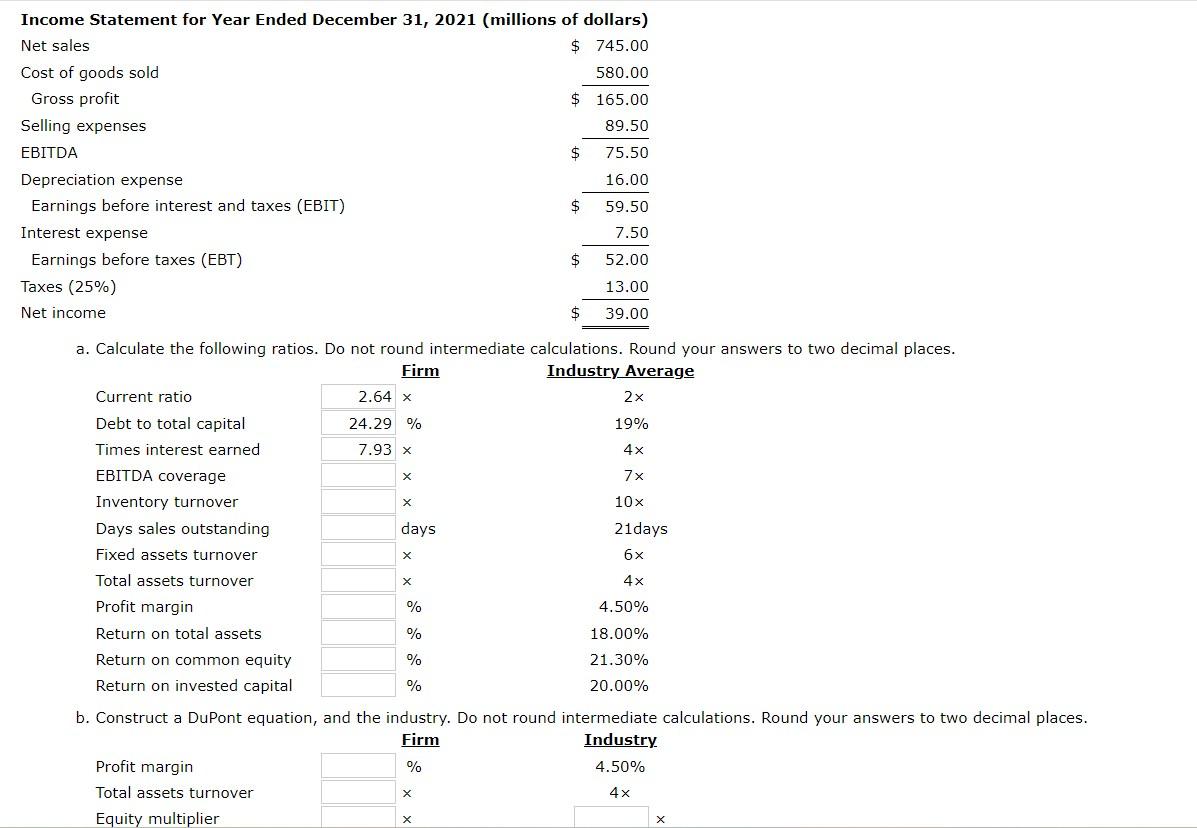
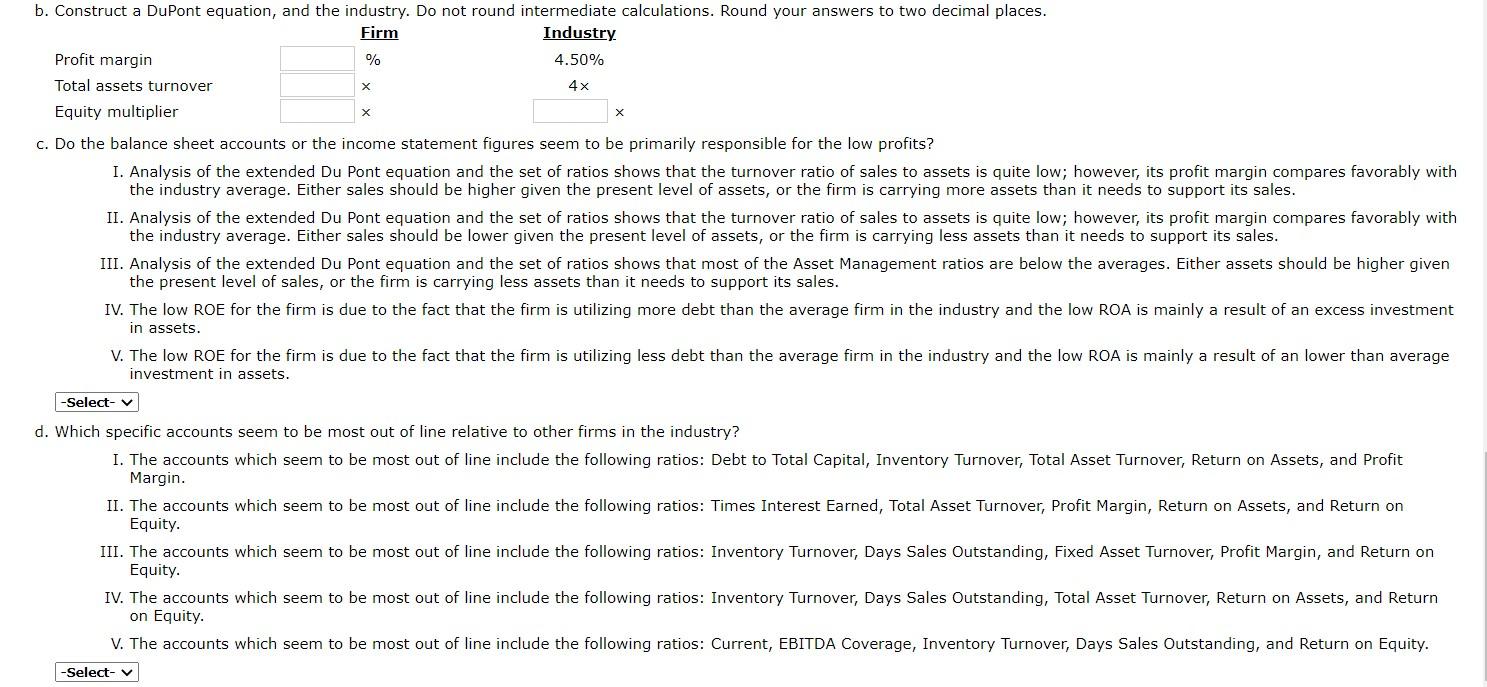
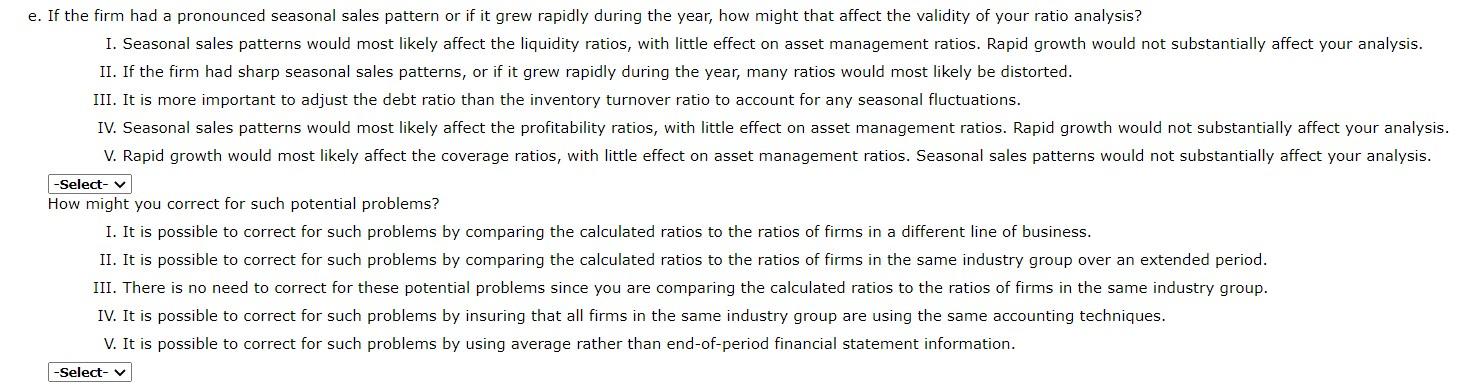
sinking fund payment on its debt. The most recent industry average ratios and the firm's financial statements are as follows: Income Statement for Year Ended December 31, 2021 (millions of dollars) Net sales \$745.00 Cost of goods sold Gross profit $165.00580.00 Selling expenses EBITDA $75.5089.50 Depreciation expense Earnings before interest and taxes (EBIT) $59.5016.00 Interest expense Earnings before taxes (EBT) $52.007.50 Taxes (25\%) Net income $$39.0013.00 a. Calculate the following ratios. Do not round intermediate calculations. Round your answers to two decimal places. b. Construct a DuPont equation, and the industry. Do not round intermediate calculations. Round your answers to two decimal places. Profit margin Firm Industry Total assets turnover % 4.50% Equity multiplier 4 c. Do the balance sheet accounts or the income statement figures seem to be primarily responsible for the low profits? the industry average. Either sales should be higher given the present level of assets, or the firm is carrying more assets than it needs to support its sales. the industry average. Either sales should be lower given the present level of assets, or the firm is carrying less assets than it needs to support its sales. the present level of sales, or the firm is carrying less assets than it needs to support its sales. in assets. investment in assets. d. Which specific accounts seem to be most out of line relative to other firms in the industry? Margin. Equity. Equity. on Equity. e. If the firm had a pronounced seasonal sales pattern or if it grew rapidly during the year, how might that affect the validity of your ratio analysis? I. Seasonal sales patterns would most likely affect the liquidity ratios, with little effect on asset management ratios. Rapid growth would not substantially affect your analysis. II. If the firm had sharp seasonal sales patterns, or if it grew rapidly during the year, many ratios would most likely be distorted. III. It is more important to adjust the debt ratio than the inventory turnover ratio to account for any seasonal fluctuations. IV. Seasonal sales patterns would most likely affect the profitability ratios, with little effect on asset management ratios. Rapid growth would not substantially affect your analysis V. Rapid growth would most likely affect the coverage ratios, with little effect on asset management ratios. Seasonal sales patterns would not substantially affect your analysis. How might you correct for such potential problems? I. It is possible to correct for such problems by comparing the calculated ratios to the ratios of firms in a different line of business. II. It is possible to correct for such problems by comparing the calculated ratios to the ratios of firms in the same industry group over an extended period. III. There is no need to correct for these potential problems since you are comparing the calculated ratios to the ratios of firms in the same industry group. IV. It is possible to correct for such problems by insuring that all firms in the same industry group are using the same accounting techniques. V. It is possible to correct for such problems by using average rather than end-of-period financial statement information
Step by Step Solution
There are 3 Steps involved in it

Get step-by-step solutions from verified subject matter experts