

Question: i want the answer with just turtle module not matplotlib C. Import turtle module of Python to draw the chart. - The area of each
 i want the answer with just turtle module not matplotlib
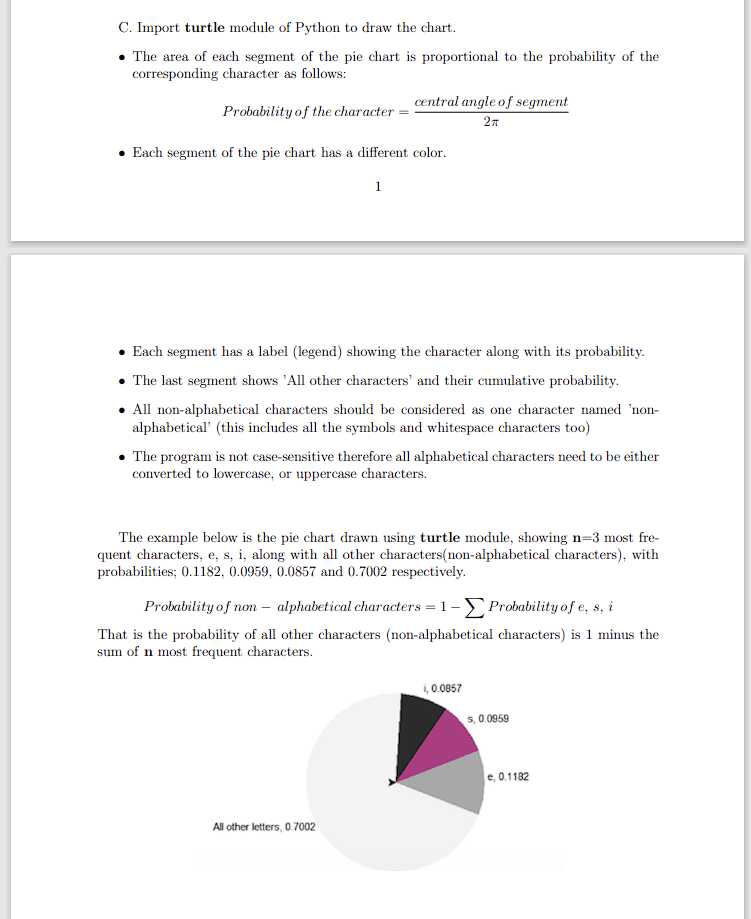
C. Import turtle module of Python to draw the chart. - The area of each segment of the pie chart is proportional to the probability of the corresponding character as follows: Probabilityofthecharacter=2centralangleofsegment - Each segment of the pie chart has a different color. 1 - Each segment has a label (legend) showing the character along with its probability. - The last segment shows 'All other characters' and their cumulative probability. - All non-alphabetical characters should be considered as one character named 'nonalphabetical' (this includes all the symbols and whitespace characters too) - The program is not case-sensitive therefore all alphabetical characters need to be either converted to lowercase, or uppercase characters. The example below is the pie chart drawn using turtle module, showing n=3 most fre
Step by Step Solution
There are 3 Steps involved in it

Get step-by-step solutions from verified subject matter experts