

Question: I will rate ASAP Given the bivariate data: 1 2 3 5 6 y 9 7 6 5 2 (a) Draw a scatter diagram for
I will rate ASAP
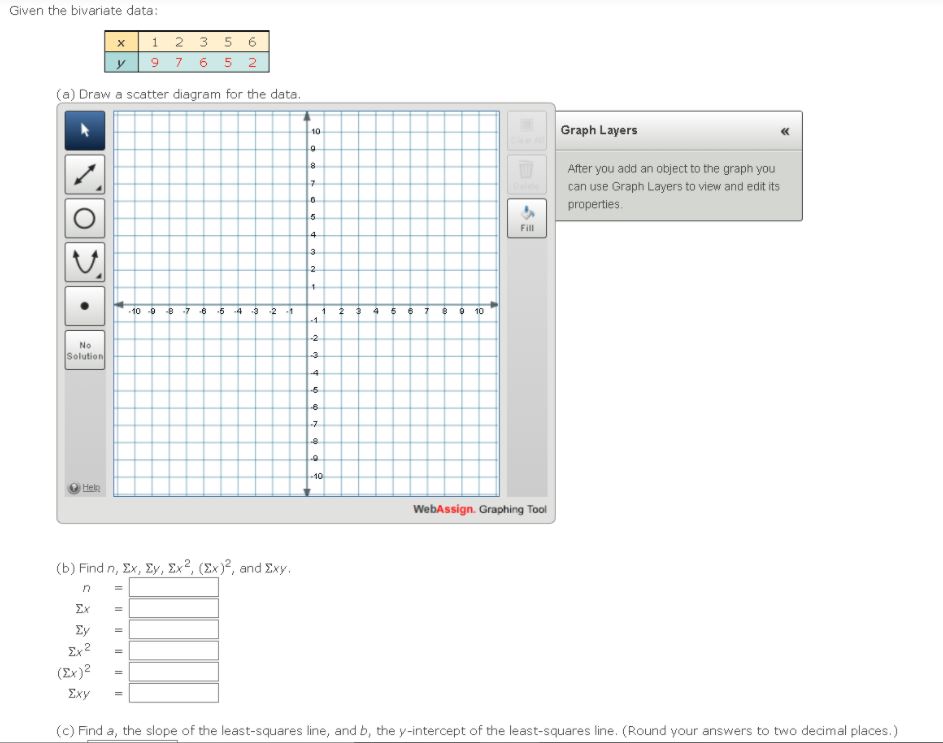
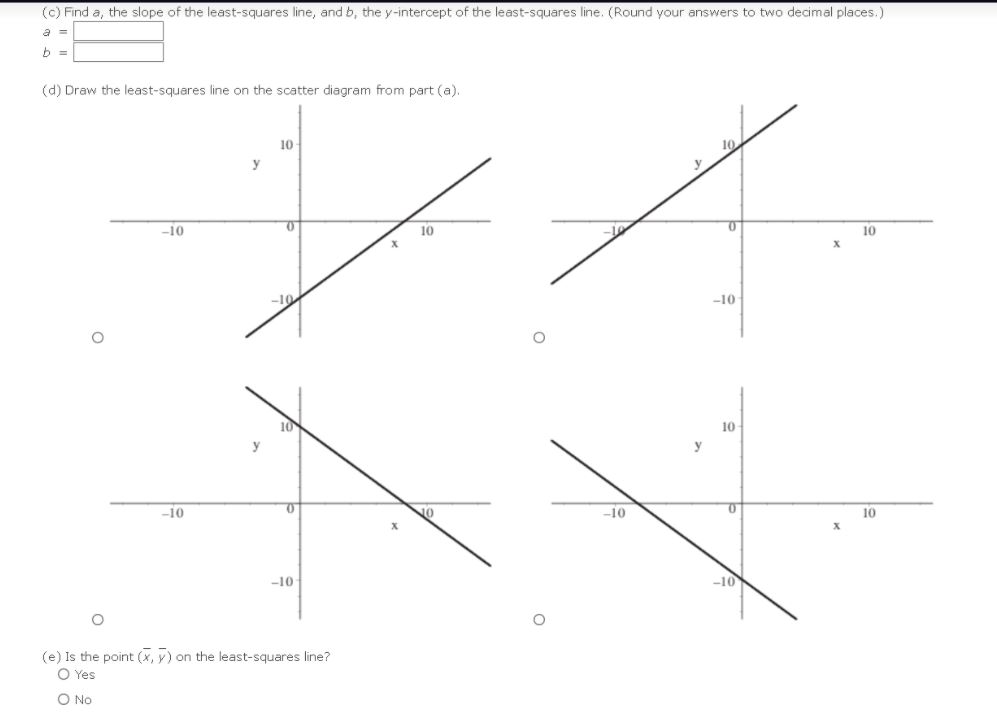
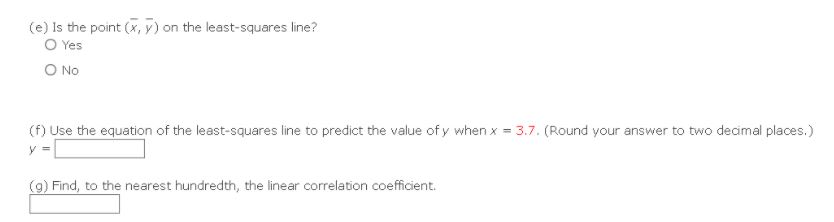
Given the bivariate data: 1 2 3 5 6 y 9 7 6 5 2 (a) Draw a scatter diagram for the data. Graph Layers After you add an object to the graph you can use Graph Layers to view and edit its properties. Fill 10 9 8 7 6 5 4 3 2 1 123 4 5 6 7 6 9 10 No Solution Hein WebAssign. Graphing Tool (b) Find n, Ex, Ey, Ex , (Ex) , and Exy. Ey Ex 2 (Ex ) 2 Exy (c) Find a, the slope of the least-squares line, and b, the y-intercept of the least-squares line. (Round your answers to two decimal places.)(c) Find a, the slope of the least-squares line, and b, the y-intercept of the least-squares line. ( Round your answers to two decimal places. ) b (d) Draw the least-squares line on the scatter diagram from part (a). 10 y 10 -10 0 10 0 10 10 O -10 O 10 y -10 10 x -10 10 X -10 -10 O (e) Is the point (x, y) on the least-squares line? O Yes O No(e) Is the point (x, y ) on the least-squares line? O Yes O No (f) Use the equation of the least-squares line to predict the value of y when x = 3.7. (Round your answer to two decimal places.) V = (g) Find, to the nearest hundredth, the linear correlation coefficient
Step by Step Solution
There are 3 Steps involved in it

Get step-by-step solutions from verified subject matter experts