

Question: I would appreciate excel screenshots and a bit of an explanation! You are working for Rubber INC, a company that specializes in producing rubber duck
I would appreciate excel screenshots and a bit of an explanation!
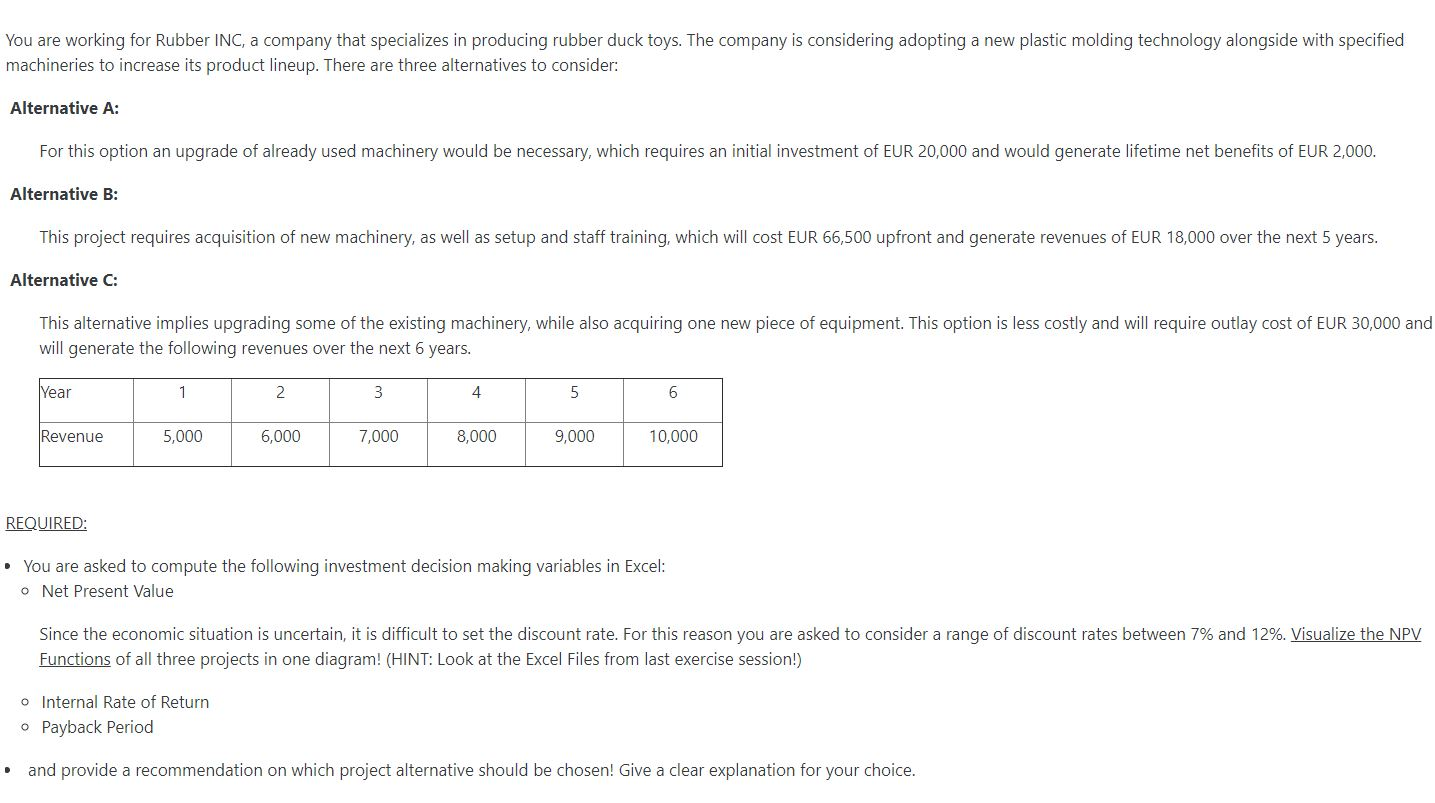
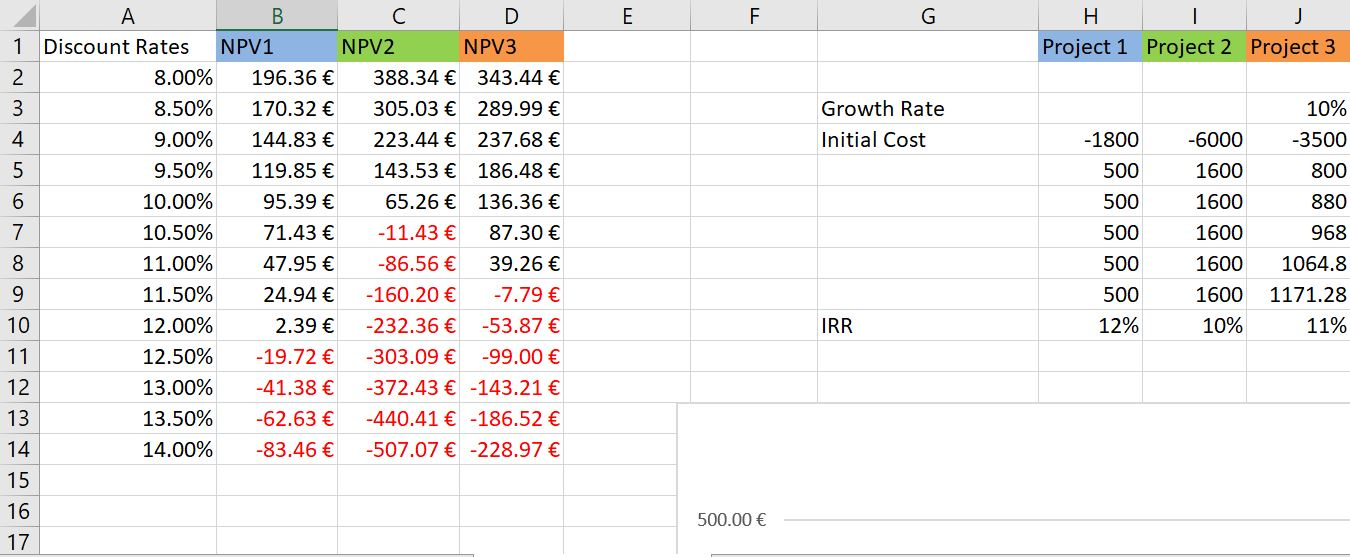
You are working for Rubber INC, a company that specializes in producing rubber duck toys. The company is considering adopting a new plastic molding technology alongside with specified machineries to increase its product lineup. There are three alternatives to consider: Alternative A: For this option an upgrade of already used machinery would be necessary, which requires an initial investment of EUR 20,000 and would generate lifetime net benefits of EUR 2,000. Alternative B: This project requires acquisition of new machinery, as well as setup and staff training, which will cost EUR 66,500 upfront and generate revenues of EUR 18,000 over the next 5 years. Alternative C: This alternative implies upgrading some of the existing machinery, while also acquiring one new piece of equipment. This option is less costly and will require outlay cost of EUR 30,000 and will generate the following revenues over the next 6 years. Year 1 2 3 4 5 6 Revenue 5,000 6,000 7,000 8,000 9,000 10,000 REQUIRED: You are asked to compute the following investment decision making variables in Excel: o Net Present Value Since the economic situation is uncertain, it is difficult to set the discount rate. For this reason you are asked to consider a range of discount rates between 7% and 12%. Visualize the NPV Functions of all three projects in one diagram! (HINT: Look at the Excel Files from last exercise session!) o Internal Rate of Return o Payback Period and provide a recommendation on which project alternative should be chosen! Give a clear explanation for your choice. A E H Project 1 Project 2 Project 3 2 Growth Rate Initial Cost -1800 500 500 500 A B C D 1 Discount Rates NPV1 NPV2 NPV3 8.00% 196.36 388.34 343.44 8.50% 170.32 305.03 289.99 9.00% 144.83 223.44 237.68 9.50% 119.85 143.53 186.48 10.00% 95.39 65.26 136.36 10.50% 71.43 -11.43 87.30 11.00% 47.95 -86.56 39.26 11.50% 24.94 160.20 -7.79 12.00% 2.39 -232.36 -53.87 12.50% -19.72 -303.09 -99.00 13.00% -41.38 -372.43 -143.21 13 13.50% -62.63 -440.41 -186.52 14 14.00% -83.46 -507.07 -228.97 15 16 17 -6000 1600 1600 1600 1600 1600 10% 10% -3500 800 880 968 1064.8 1171.28 11% 500 500 IRR 12% 11 12 500.00
Step by Step Solution
There are 3 Steps involved in it

Get step-by-step solutions from verified subject matter experts