

Question: I would like to know how I can use if statements to draw a picture of different markets in each quadrant by python matplotlib, the
I would like to know how I can use if statements to draw a picture of different markets in each quadrant by python matplotlib, the output should be like this
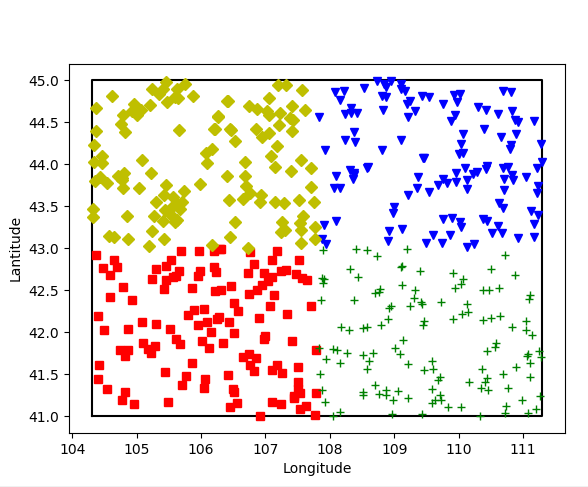
45.0 44.5 44.0 43.5 43.0 42.5 42.0 41.5 41.0 104 105 106 107 108 109 110 Longitude
Step by Step Solution
There are 3 Steps involved in it
1 Expert Approved Answer
Step: 1 Unlock

Question Has Been Solved by an Expert!
Get step-by-step solutions from verified subject matter experts
Step: 2 Unlock
Step: 3 Unlock