

Question: Identify Cost Graphs The following cost graphs illustrate various types of cost behavior: For each of the following costs, identify the cost graph that best
Identify Cost Graphs
The following cost graphs illustrate various types of cost behavior:
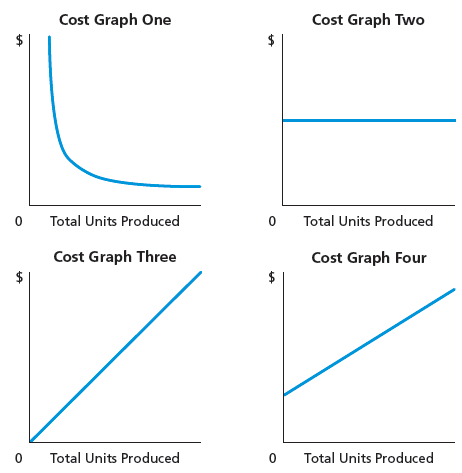
For each of the following costs, identify the cost graph that best illustrates its cost behavior as the number of units produced increases.
A) Total direct materials cost
1.Cost Graph One
2. Cost Graph Two
3.Cost Graph Three
4. Cost Graph Four
B) Electricity cost of $1,000 per month plus $0.10 per kilowatt-hour
1.Cost Graph One
2. Cost Graph Two
3.Cost Graph Three
4. Cost Graph Four
C) Per-unit cost of straight-line depreciation on factory equipment
1.Cost Graph One
2. Cost Graph Two
3.Cost Graph Three
4. Cost Graph Four
D) Salary of quality control supervisor, $20,000 per month
1.Cost Graph One
2. Cost Graph Two
3.Cost Graph Three
4. Cost Graph Four
E) Per-unit direct labor cost
1.Cost Graph One
2. Cost Graph Two
3.Cost Graph Three
4. Cost Graph Four
Step by Step Solution
There are 3 Steps involved in it

Get step-by-step solutions from verified subject matter experts