

Question: Identify Cost Graphs The following cost graphs illustrate various types of cost behavior: Cost Graph One Cost Graph Two 0 Total Units Produced 0 Total
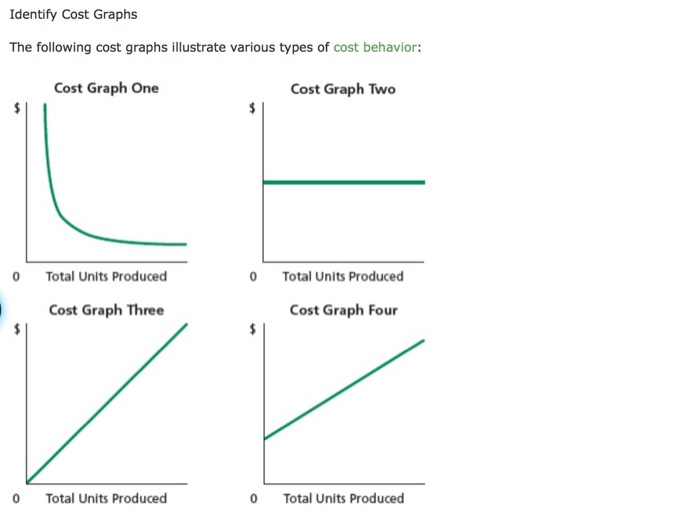
Identify Cost Graphs The following cost graphs illustrate various types of cost behavior: Cost Graph One Cost Graph Two 0 Total Units Produced 0 Total Units Produced Cost Graph Three Cost Graph Four 0 Total Units Produced 0 Total Units Produced
Step by Step Solution
There are 3 Steps involved in it
1 Expert Approved Answer
Step: 1 Unlock

Question Has Been Solved by an Expert!
Get step-by-step solutions from verified subject matter experts
Step: 2 Unlock
Step: 3 Unlock