

Question: If any code involved, do so in R please. # Demonstration of Simpson's paradox on the famous UCB graduate admissions data. # first understand marginial
If any code involved, do so in R please.
# Demonstration of Simpson's paradox on the famous UCB graduate admissions data.
# first understand marginial tables and conditional tables
data("UCBAdmissions"); # import the data ucb = UCBAdmissions; # abbreviate "UCBAdmissions" print(dimnames(ucb)); # 6 departments acceptance results by gender print(ucb["Admitted",,]) # 2-way table of admitted students (gender and department) print(t(ucb["Admitted",,])) # "transpose" of table (flip rows and cols) print(ucb["Admitted","Male",]) # 1-way table of admitted male students (department) print(ucb["Rejected",,"A"]) # 1-way table of rejected students from department A (gender) print(apply(ucb,"Admit",sum)); # 1-way table of Admit status (summming out others) print(apply(ucb,c("Admit","Dept"),sum)); # 2-way table of Admit status and Dept (summming out gender) print(apply(ucb["Admitted",,],"Dept",sum)); # 1-way table Dept, restricted to Admitted students (summming out gender) stopp; print(apply(ucb,c("Gender","Admit"),sum)); # 2-way table of Gender x Admit mosaicplot(apply(ucb,c("Gender","Admit"),sum)); # mosaic plot clearer ...
# table shows clear gender bias against Female students
# ... or does it ...?
mosaicplot(t(ucb[,,"A"])); # department A seems to *favor* Females mosaicplot(t(ucb[,,"B"])); # B seems neutral (admission indep of gender)m mosaicplot(t(ucb[,,"C"])); # so are others ... mosaicplot(t(ucb[,,"D"])); mosaicplot(t(ucb[,,"E"])); mosaicplot(t(ucb[,,"F"]));
# what is going on !?!?
mosaicplot(apply(ucb,c("Dept","Admit"),sum)); # depts accept rates differ
# to facilitate understanding departments are ordered A ... F from easier to harder
mosaicplot(apply(ucb,c("Dept","Gender"),sum)); # men apply more to easier depts A and B
# moral: summing out (marginalizing) over variables can give misleading results
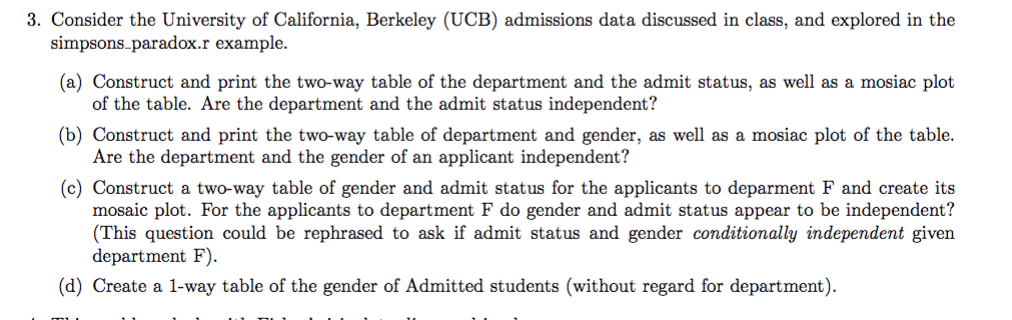
3. Consider the University of California, Berkeley (UCB) admissions data discussed in class, and explored in the (a) Construct and print the two-way table of the department and the admit status, as well as a mosiac plot b) Construct and print the two-way table of department and gender, as well as a mosiac plot of the table. simpsons- paradox.r example . of the table. Are the department and the admit status independent? Are the department and the gender of an applicant independent? (c) Construct a two-way table of gender and admit status for the applicants to deparment F and create its mosaic plot. For the applicants to department F do gender and admit status appear to be independent? (This question could be rephrased to ask if admit status and gender conditionally independent given department F). d) Create a 1-way table of the gender of Admitted students (without regard for department). 3. Consider the University of California, Berkeley (UCB) admissions data discussed in class, and explored in the (a) Construct and print the two-way table of the department and the admit status, as well as a mosiac plot b) Construct and print the two-way table of department and gender, as well as a mosiac plot of the table. simpsons- paradox.r example . of the table. Are the department and the admit status independent? Are the department and the gender of an applicant independent? (c) Construct a two-way table of gender and admit status for the applicants to deparment F and create its mosaic plot. For the applicants to department F do gender and admit status appear to be independent? (This question could be rephrased to ask if admit status and gender conditionally independent given department F). d) Create a 1-way table of the gender of Admitted students (without regard for department)
Step by Step Solution
There are 3 Steps involved in it

Get step-by-step solutions from verified subject matter experts