

Question: ***If you can solve these questions on Excel, it will be better. If you cannot, that's okay*** You plan to test the market efficiency of
***If you can solve these questions on Excel, it will be better. If you cannot, that's okay***
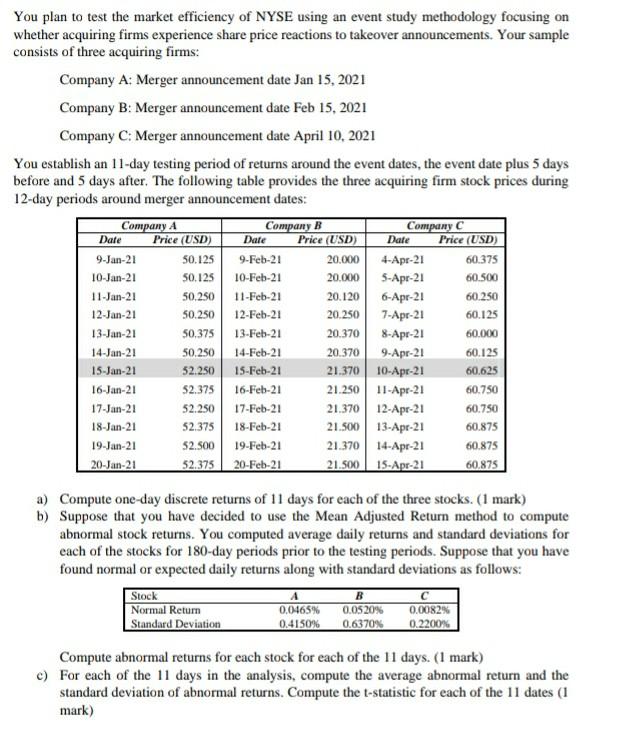
You plan to test the market efficiency of NYSE using an event study methodology focusing on whether acquiring firms experience share price reactions to takeover announcements. Your sample consists of three acquiring firms: Company A: Merger announcement date Jan 15, 2021 Company B: Merger announcement date Feb 15, 2021 Company C: Merger announcement date April 10, 2021 You establish an 11-day testing period of returns around the event dates, the event date plus 5 days before and 5 days after. The following table provides the three acquiring firm stock prices during 12-day periods around merger announcement dates: Company A Company B Company C Price (USD) Price (USD) Price (USD) 9-Jan-21 50.125 20.000 4-Apr-21 10-Jan-21 10-Feb-21 20.000 5-Apr-21 60.500 11-Jan-21 11-Feb-21 20.120 6-Apr-21 60.250 12-Jan-21 50.250 12-Feb-21 20.250 7-Apr-21 60.125 13-Jan-21 13-Feb-21 20.370 8-Apr-21 14-Jan-21 50.250 14-Feb-21 20.3709-Apr-21 60.125 15-Jan-21 52.250 15-Feb-21 21.370 10-Apr-21 60.625 16-Jan-21 52.375 16-Feb-21 21.250 11-Apr-21 60.750 17-Jan-21 52.250 17-Feb-21 21.370 12-Apr-21 18-Jan-21 52.375 18-Feb-21 21.500 13-Apr-21 19-Jan-21 19-Feb-21 21.370 14-Apr-21 20-Jan-21 52.375 20-Feb-21 21.500 15-Apr-21 60.875 Date Date Date 9-Feb-21 60.375 50.125 50.250 50,375 60.000 60.750 60.875 52.500 60.875 a) Compute one-day discrete returns of 11 days for each of the three stocks. (1 mark) b) Suppose that you have decided to use the Mean Adjusted Return method to compute abnormal stock returns. You computed average daily returns and standard deviations for each of the stocks for 180-day periods prior to the testing periods. Suppose that you have found normal or expected daily returns along with standard deviations as follows: Stock Normal Return 0.0520% 0.0082% Standard Deviation 0.4150% 0.6370% 0.2200% 0.0465% Compute abnormal returns for each stock for each of the 11 days. (1 mark) c) For each of the 11 days in the analysis, compute the average abnormal return and the standard deviation of abnormal returns. Compute the t-statistic for each of the 11 dates (1 mark) You plan to test the market efficiency of NYSE using an event study methodology focusing on whether acquiring firms experience share price reactions to takeover announcements. Your sample consists of three acquiring firms: Company A: Merger announcement date Jan 15, 2021 Company B: Merger announcement date Feb 15, 2021 Company C: Merger announcement date April 10, 2021 You establish an 11-day testing period of returns around the event dates, the event date plus 5 days before and 5 days after. The following table provides the three acquiring firm stock prices during 12-day periods around merger announcement dates: Company A Company B Company C Price (USD) Price (USD) Price (USD) 9-Jan-21 50.125 20.000 4-Apr-21 10-Jan-21 10-Feb-21 20.000 5-Apr-21 60.500 11-Jan-21 11-Feb-21 20.120 6-Apr-21 60.250 12-Jan-21 50.250 12-Feb-21 20.250 7-Apr-21 60.125 13-Jan-21 13-Feb-21 20.370 8-Apr-21 14-Jan-21 50.250 14-Feb-21 20.3709-Apr-21 60.125 15-Jan-21 52.250 15-Feb-21 21.370 10-Apr-21 60.625 16-Jan-21 52.375 16-Feb-21 21.250 11-Apr-21 60.750 17-Jan-21 52.250 17-Feb-21 21.370 12-Apr-21 18-Jan-21 52.375 18-Feb-21 21.500 13-Apr-21 19-Jan-21 19-Feb-21 21.370 14-Apr-21 20-Jan-21 52.375 20-Feb-21 21.500 15-Apr-21 60.875 Date Date Date 9-Feb-21 60.375 50.125 50.250 50,375 60.000 60.750 60.875 52.500 60.875 a) Compute one-day discrete returns of 11 days for each of the three stocks. (1 mark) b) Suppose that you have decided to use the Mean Adjusted Return method to compute abnormal stock returns. You computed average daily returns and standard deviations for each of the stocks for 180-day periods prior to the testing periods. Suppose that you have found normal or expected daily returns along with standard deviations as follows: Stock Normal Return 0.0520% 0.0082% Standard Deviation 0.4150% 0.6370% 0.2200% 0.0465% Compute abnormal returns for each stock for each of the 11 days. (1 mark) c) For each of the 11 days in the analysis, compute the average abnormal return and the standard deviation of abnormal returns. Compute the t-statistic for each of the 11 dates (1 mark)
Step by Step Solution
There are 3 Steps involved in it

Get step-by-step solutions from verified subject matter experts