

Question: TE01 2 CASE I: Testing market efficiency using event study methodology Instructions: Form a group of students and submit your excel file via the ITC.
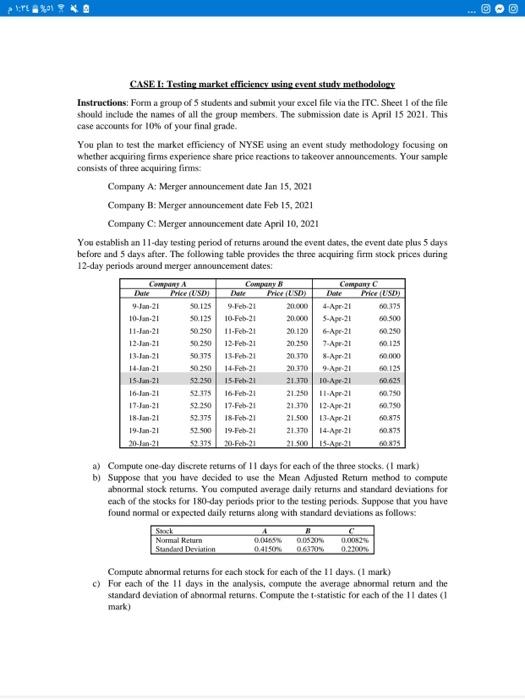


TE01 2 CASE I: Testing market efficiency using event study methodology Instructions: Form a group of students and submit your excel file via the ITC. Sheet 1 of the file should include the names of all the group members. The submission date is April 15 2021. This case accounts for 10% of your final grade. You plan to test the market efficiency of NYSE using an event study methodology focusing on whether acquiring firms experience share price reactions to takeover announcements. Your sample consists of three acquiring firms. Company A: Merger announcement date Jan 15, 2021 Company B: Merger announcement date Feb 15, 2021 Company C: Merger announcement date April 10, 2021 You establish an 11-day testing period of returns around the event dates, the event date plus 5 days before and 5 days after. The folkswing table provides the three acquiring firm stock prices during 12-day periods around merger announcement dates: COWA Company Price (USD) Price (USD) le Pric UNDI 9-Jan-21 $0.125 9.Feb 21 20.000 60.375 10-Jan-21 $0.125 10-Feb-21 20.000 S-Apr-21 60.500 11-Jan-21 50.250 11-Feb-21 20120 6-Apr-21 12 Jan 21 50.250 12-Feb-21 20.350 7.Apr 21 0.125 13-Jan-21 50.375 13.Fe 21 20 170 8-Apr 21 60.000 14.Jan 21 30.250 14. Fe 21 20170 9. Apr 21 0125 15-Jun-21 $2250 15-Feb-21 21.370 10-Apr-21 0.625 16-Jan-21 52.175 16-Feb-21 21.250 11 Apr 21 0.750 17. Jan 21 52250 17-Feb-21 21.370 12-Apr-21 0.750 18-Jan-21 52.375 18-Feb-21 21.500 13-Apr-21 60.875 19-Jan-21 $2.500 19-Feb-21 21.370 14-Apr-21 0.875 52.375 20.Feb 21 21.500 15.21 60.875 a) Compute one day discrete returns of 11 days for each of the three stocks (1 mark) b) Suppose that you have decided to use the Mean Adjusted Retum method to compute abnormal stock retums. You computed average daily returns and standard deviations for each of the stocks for 180-day periods prior to the testing periods Suppose that you have found normal or expected daily returns along with standard deviations as follows: R Normal Return 0.04009 0.020 24 Standard Deviation 04150 Compute abnormal returns for each stock for each of the 11 days. (1 mark) c) For each of the 11 days in the analysis, compute the average abnormal return and the standard deviation of absormal returns. Compute the statistic for each of the 11 dates mark) TE01 kg d) Does there appear to be statistically significant evidence of aboormal acquiring firm returns around announcement dates? (1 mark) c) For each of the 11 days in the analysis , compute the cumulative abnormal returns (CARS) for the three stocks. (1 mark) ) For each day, estimate the mean and the standard deviation of CARs. Compute the statistic for each of the 11 dates (1 mark) g) Draw the CARs for the three stocks (1 mark) h) Write down the hypothesis you are testing, identify the critical values at 95% significance level. (1 mark) i) Test the hypothesis that you wrote in part h. Are the average CARs for any of the dates statistically significant from zero at the 95% level? (1 mark) 1) Can you make a conclusion about the market efficiency in this case? Why ar why not? (1 mark) Enjoy the exercise TE01 kg d) Does there appear to be statistically significant evidence of aboormal acquiring firm returns around announcement dates? (1 mark) c) For each of the 11 days in the analysis , compute the cumulative abnormal returns (CARS) for the three stocks. (1 mark) ) For each day, estimate the mean and the standard deviation of CARs. Compute the statistic for each of the 11 dates (1 mark) g) Draw the CARs for the three stocks (1 mark) h) Write down the hypothesis you are testing, identify the critical values at 95% significance level. (1 mark) i) Test the hypothesis that you wrote in part h. Are the average CARs for any of the dates statistically significant from zero at the 95% level? (1 mark) 1) Can you make a conclusion about the market efficiency in this case? Why ar why not? (1 mark) Enjoy the exercise TE01 2 CASE I: Testing market efficiency using event study methodology Instructions: Form a group of students and submit your excel file via the ITC. Sheet 1 of the file should include the names of all the group members. The submission date is April 15 2021. This case accounts for 10% of your final grade. You plan to test the market efficiency of NYSE using an event study methodology focusing on whether acquiring firms experience share price reactions to takeover announcements. Your sample consists of three acquiring firms. Company A: Merger announcement date Jan 15, 2021 Company B: Merger announcement date Feb 15, 2021 Company C: Merger announcement date April 10, 2021 You establish an 11-day testing period of returns around the event dates, the event date plus 5 days before and 5 days after. The folkswing table provides the three acquiring firm stock prices during 12-day periods around merger announcement dates: COWA Company Price (USD) Price (USD) le Pric UNDI 9-Jan-21 $0.125 9.Feb 21 20.000 60.375 10-Jan-21 $0.125 10-Feb-21 20.000 S-Apr-21 60.500 11-Jan-21 50.250 11-Feb-21 20120 6-Apr-21 12 Jan 21 50.250 12-Feb-21 20.350 7.Apr 21 0.125 13-Jan-21 50.375 13.Fe 21 20 170 8-Apr 21 60.000 14.Jan 21 30.250 14. Fe 21 20170 9. Apr 21 0125 15-Jun-21 $2250 15-Feb-21 21.370 10-Apr-21 0.625 16-Jan-21 52.175 16-Feb-21 21.250 11 Apr 21 0.750 17. Jan 21 52250 17-Feb-21 21.370 12-Apr-21 0.750 18-Jan-21 52.375 18-Feb-21 21.500 13-Apr-21 60.875 19-Jan-21 $2.500 19-Feb-21 21.370 14-Apr-21 0.875 52.375 20.Feb 21 21.500 15.21 60.875 a) Compute one day discrete returns of 11 days for each of the three stocks (1 mark) b) Suppose that you have decided to use the Mean Adjusted Retum method to compute abnormal stock retums. You computed average daily returns and standard deviations for each of the stocks for 180-day periods prior to the testing periods Suppose that you have found normal or expected daily returns along with standard deviations as follows: R Normal Return 0.04009 0.020 24 Standard Deviation 04150 Compute abnormal returns for each stock for each of the 11 days. (1 mark) c) For each of the 11 days in the analysis, compute the average abnormal return and the standard deviation of absormal returns. Compute the statistic for each of the 11 dates mark) TE01 kg d) Does there appear to be statistically significant evidence of aboormal acquiring firm returns around announcement dates? (1 mark) c) For each of the 11 days in the analysis , compute the cumulative abnormal returns (CARS) for the three stocks. (1 mark) ) For each day, estimate the mean and the standard deviation of CARs. Compute the statistic for each of the 11 dates (1 mark) g) Draw the CARs for the three stocks (1 mark) h) Write down the hypothesis you are testing, identify the critical values at 95% significance level. (1 mark) i) Test the hypothesis that you wrote in part h. Are the average CARs for any of the dates statistically significant from zero at the 95% level? (1 mark) 1) Can you make a conclusion about the market efficiency in this case? Why ar why not? (1 mark) Enjoy the exercise TE01 kg d) Does there appear to be statistically significant evidence of aboormal acquiring firm returns around announcement dates? (1 mark) c) For each of the 11 days in the analysis , compute the cumulative abnormal returns (CARS) for the three stocks. (1 mark) ) For each day, estimate the mean and the standard deviation of CARs. Compute the statistic for each of the 11 dates (1 mark) g) Draw the CARs for the three stocks (1 mark) h) Write down the hypothesis you are testing, identify the critical values at 95% significance level. (1 mark) i) Test the hypothesis that you wrote in part h. Are the average CARs for any of the dates statistically significant from zero at the 95% level? (1 mark) 1) Can you make a conclusion about the market efficiency in this case? Why ar why not? (1 mark) Enjoy the exercise
Step by Step Solution
There are 3 Steps involved in it

Get step-by-step solutions from verified subject matter experts