

Question: I'll respond after checking for correctness. Thank you d. (3 pts) Construct a 95% confidence interval for the true slope of the linear relationship between
I'll respond after checking for correctness. Thank you
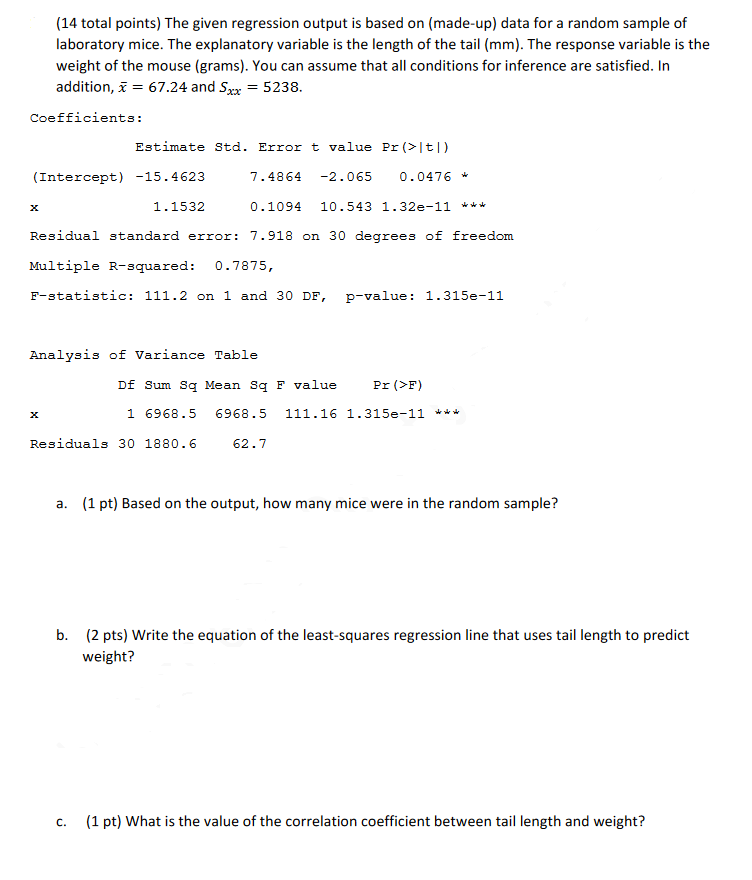
d. (3 pts) Construct a 95% confidence interval for the true slope of the linear relationship between tail length and weight. You do not have to interpret the interval. e. (6 pts) Do the data provide evidence at a = .05 that the true average weight for mice with tail length 70mm is less than 68 grams? f. (1 pt) If your conclusion in part e doesn't match up with the truth, what type of error did you make?[14 total points] The given regression output is based on [made-up] data for a random sample of laboratory mice. The explanatory variable is the length of the tail [mm]. The response variable is the weight of the mouse {grams}. You can assume that all conditions for inference are satisfied. In additionsc = 6124 and 5n = 5233. Coefficients: Estimate Std. Errcr t value Pr[}|t|} {Intercept} -15.4623 T.4E64 -2.065 0.0476 * x 1.1532 0.1094 10.543 1.32e-11 *** Residual standard error: T.518 en 30 degrees of freedom Multiple R-squared: 0.?ST5, Fstatistic: 111.2 on 1 and 30 DF, p-value: 1.315e-11 Analysis of Variance Table Df Sum Sq HEan Sq F value Pr{}F} x 1 6963.5 6968.5 111.16 1.315e-11 *** Residuals 30 1080.6 62.? a. {1 pt] Based on the output. how many mice were in the random sample? b. [2 pts] Write the equation of the least-squares regression line that uses tail length to predict weight? c. [1 pt} What is the value of the correlation coefficient between tail length and weight
Step by Step Solution
There are 3 Steps involved in it

Get step-by-step solutions from verified subject matter experts