

Question: Im trying to do a currency/stock correlation matrix from march 31 2018 to march 31 2019. The stocks included in the matrix is Sony (SNE)
Im trying to do a currency/stock correlation matrix from march 31 2018 to march 31 2019. The stocks included in the matrix is Sony (SNE) and the s&p 500. Sony's functional currency is the Yen. All other currencies on the matrix are ones that Sony has to deal with since they work in various parts of the world. While it'd be great for someone to work all this out I understand it would be a lot of work. I need know what data to use.
1) I'm confused on whether I use data for YEN/USD or USD/YEN, EURO/YEN or YEN/EURO etc.
2) Do I use % change of the data or the raw data itself?
3) I don't know how to do a correlation for a stock like Sony in relation to a currency so any help would be appreciated. Ill gladly drop a like. 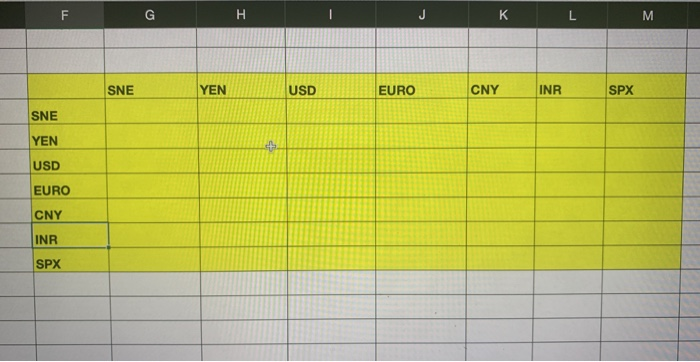
For the person that responded:
It is a whole years worth of data for multiple currencies. I don't think you'd want to manually type all that Information in.
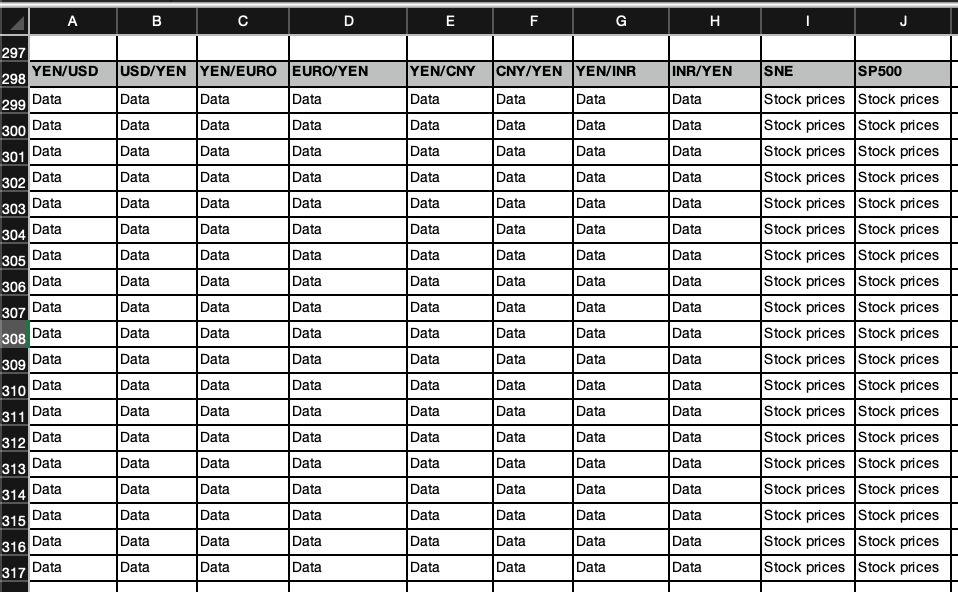
Let's just assume I have all the data for the following currencies and stocks
How would I make a correlation matrix based off of the data? My ideal answer would be a chart like the yellow one I provided with cell references to the same cells that the data is in. I hope this helps.
KL SNE YEN USD EURO CNY INR SPX SNE YEN USD EURO CNY INR SPX E F G H I J 297 200 YEN/USD 299 Data IData Data 300 Data 301 Data 302 Data 303 Data 304 Data 305 Data 306 Data 307 Data 308 Data 309 Data 310 Data 311 Data 312 Data 313 Data 314 Data 315 Data 316 Data 317 Data USD/YEN YEN/EURO EURO/YEN Data Data Data Data Data Data Data Data Data Data Data Data Data Data Data Data Data Data Data Data Data Data Data Data Data Data Data Data Data Data Data Data Data Data Data Data Data Data Data Data Data Data Data Data Data Data Data Data Data Data Data Data Data Data Data Data YEN/CNYCNY/YEN YEN/INR Data Data Data Data Data Data Data Data Data Data Data Data Data Data Data Data Data Data Data Data Data Data Data Data Data Data Data Data Data Data Data Data Data Data Data Data Data Data Data Data Data Data Data Data Data Data Data Data Data Data Data Data Data Data Data Data INR/YEN Data Data Data Data Data Data Data Data Data Data Data Data Data Data Data Data Data Data Data SNE SP500 Stock prices Stock prices Stock prices Stock prices Stock prices Stock prices Stock prices Stock prices Stock prices Stock prices Stock prices Stock prices Stock prices Stock prices Stock prices Stock prices Stock prices Stock prices Stock prices Stock prices Stock prices Stock prices Stock prices Stock prices Stock prices Stock prices Stock prices Stock prices Stock prices Stock prices Stock prices Stock prices Stock prices Stock prices Stock prices Stock prices Stock prices Stock prices ata
Step by Step Solution
There are 3 Steps involved in it

Get step-by-step solutions from verified subject matter experts