

Question: Im using R studio to solve this. I only need C and D. please help if you can. = 0 7.26 The data file br2
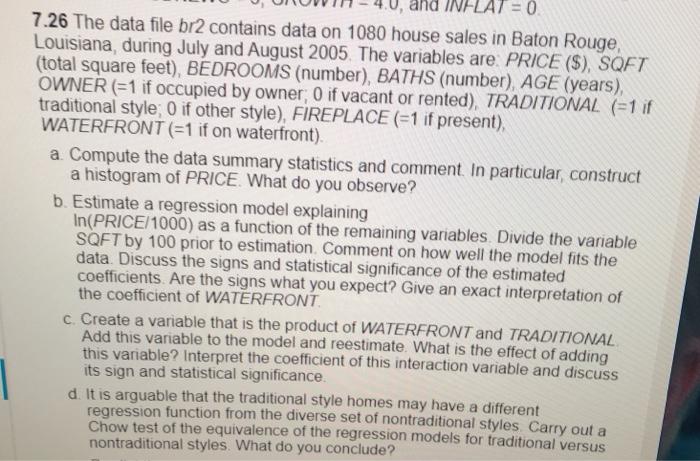
= 0 7.26 The data file br2 contains data on 1080 house sales in Baton Rouge, Louisiana, during July and August 2005 The variables are PRICE ($), SQFT (total square feet), BEDROOMS (number), BATHS (number), AGE (years), OWNER (=1 if occupied by owner, 0 if vacant or rented), TRADITIONAL (=1 if traditional style: 0 if other style), FIREPLACE(=1 if present). WATERFRONT (=1 if on waterfront) a Compute the data summary statistics and comment. In particular, construct a histogram of PRICE. What do you observe? b. Estimate a regression model explaining In(PRICE/1000) as a function of the remaining variables. Divide the variable SQFT by 100 prior to estimation Comment on how well the model fits the data Discuss the signs and statistical significance of the estimated coefficients Are the signs what you expect? Give an exact interpretation of the coefficient of WATERFRONT c. Create a variable that is the product of WATERFRONT and TRADITIONAL Add this variable to the model and reestimate What is the effect of adding this variable? Interpret the coefficient of this interaction variable and discuss its sign and statistical significance. d. It is arguable that the traditional style homes may have a different regression function from the diverse set of nontraditional styles Carry out a Chow test of the equivalence of the regression models for traditional versus nontraditional styles. What do you conclude? = 0 7.26 The data file br2 contains data on 1080 house sales in Baton Rouge, Louisiana, during July and August 2005 The variables are PRICE ($), SQFT (total square feet), BEDROOMS (number), BATHS (number), AGE (years), OWNER (=1 if occupied by owner, 0 if vacant or rented), TRADITIONAL (=1 if traditional style: 0 if other style), FIREPLACE(=1 if present). WATERFRONT (=1 if on waterfront) a Compute the data summary statistics and comment. In particular, construct a histogram of PRICE. What do you observe? b. Estimate a regression model explaining In(PRICE/1000) as a function of the remaining variables. Divide the variable SQFT by 100 prior to estimation Comment on how well the model fits the data Discuss the signs and statistical significance of the estimated coefficients Are the signs what you expect? Give an exact interpretation of the coefficient of WATERFRONT c. Create a variable that is the product of WATERFRONT and TRADITIONAL Add this variable to the model and reestimate What is the effect of adding this variable? Interpret the coefficient of this interaction variable and discuss its sign and statistical significance. d. It is arguable that the traditional style homes may have a different regression function from the diverse set of nontraditional styles Carry out a Chow test of the equivalence of the regression models for traditional versus nontraditional styles. What do you conclude
Step by Step Solution
There are 3 Steps involved in it

Get step-by-step solutions from verified subject matter experts