

Question: I'm working on a business case study and need an explanation to help me learn. 1. Create and interpret a P Chart for each of
I'm working on a business case study and need an explanation to help me learn.
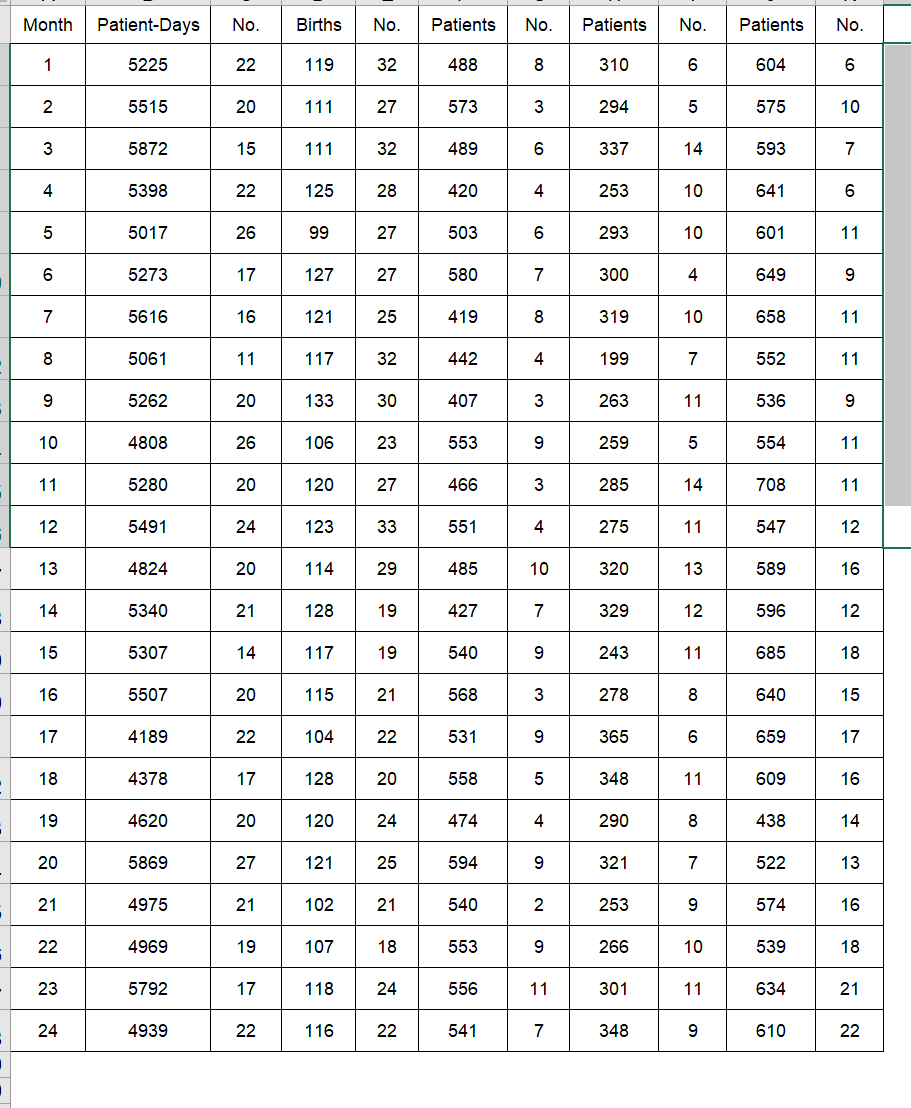
1. Create and interpret a P Chart for each of the outcomes analyzed in the case (an Excel file with the data is provided). Interpret each P chart based on the Shewhart interpretation rules. Use the Excel Control Chart template.
2.
- For processes that are stable, compare Laralexs performance with external benchmarks. Use the Excel Control Chart template. Assume that a very large group of peer hospitals had the following average proportions:
- Discrepant X-rays - 1.11%
- Unscheduled Readmissions - 4.6%
- Hospital-Acquired Infections - 0.30%
- Cesarean Sections - 19.2%
- Patients who Leave the ED Prior to Treatment 3.3%
Step by Step Solution
There are 3 Steps involved in it
1 Expert Approved Answer
Step: 1 Unlock

Question Has Been Solved by an Expert!
Get step-by-step solutions from verified subject matter experts
Step: 2 Unlock
Step: 3 Unlock