

Question: Image processing class and MATLAB code Image Enhancement Using Intensity Transformations The focus of this project is to experiment with intensity transformations to enhance an
Image processing class and MATLAB code
Image Enhancement Using Intensity Transformations
The focus of this project is to experiment with intensity transformations to enhance an image. Download phoenix lander.tif and enhance it using 1. The log transformation of Note 3, page 8:
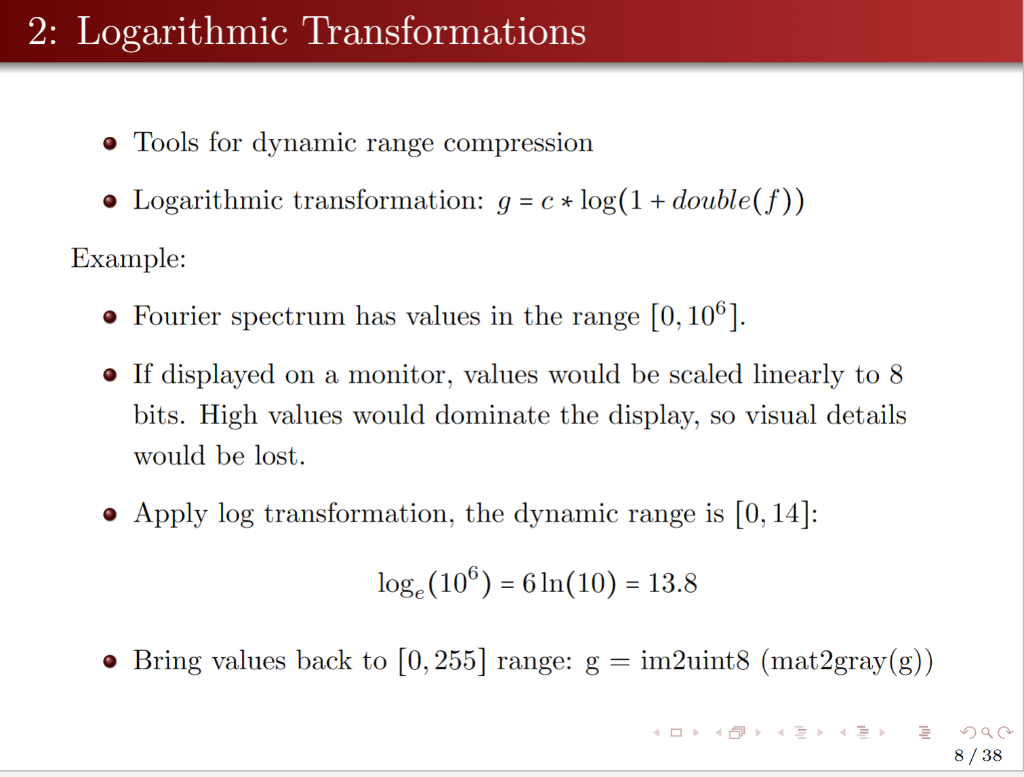
g = c log(1 + f )
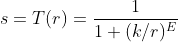
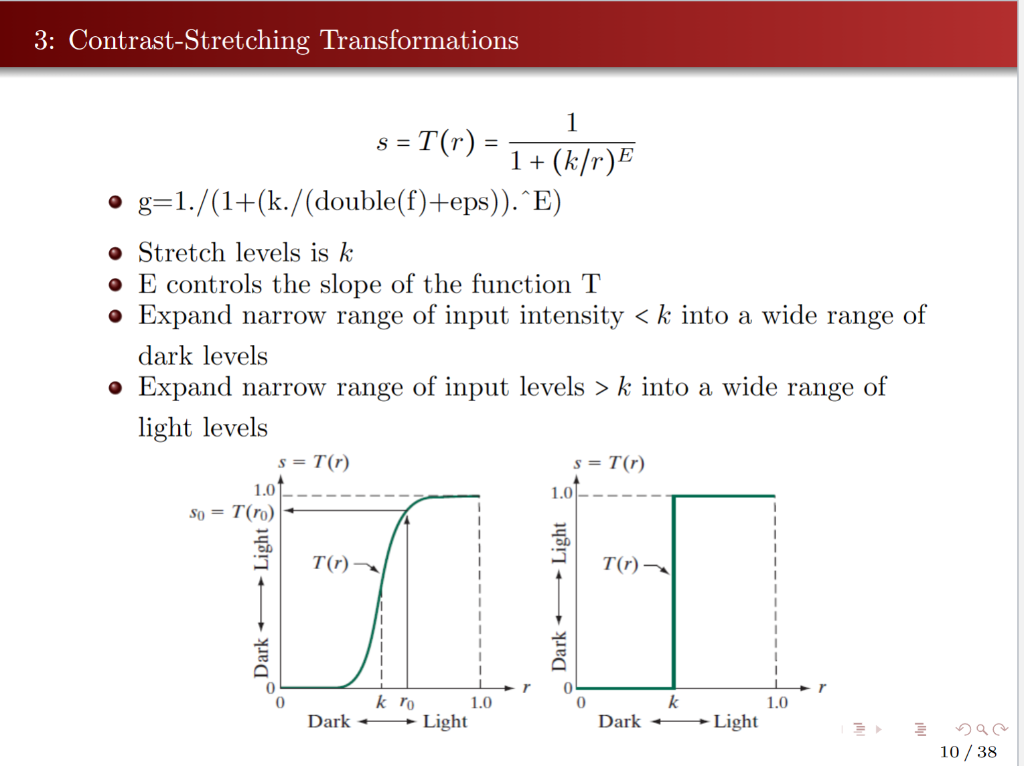
2. A power-law transformation of the form shown in Note 3, page 10.
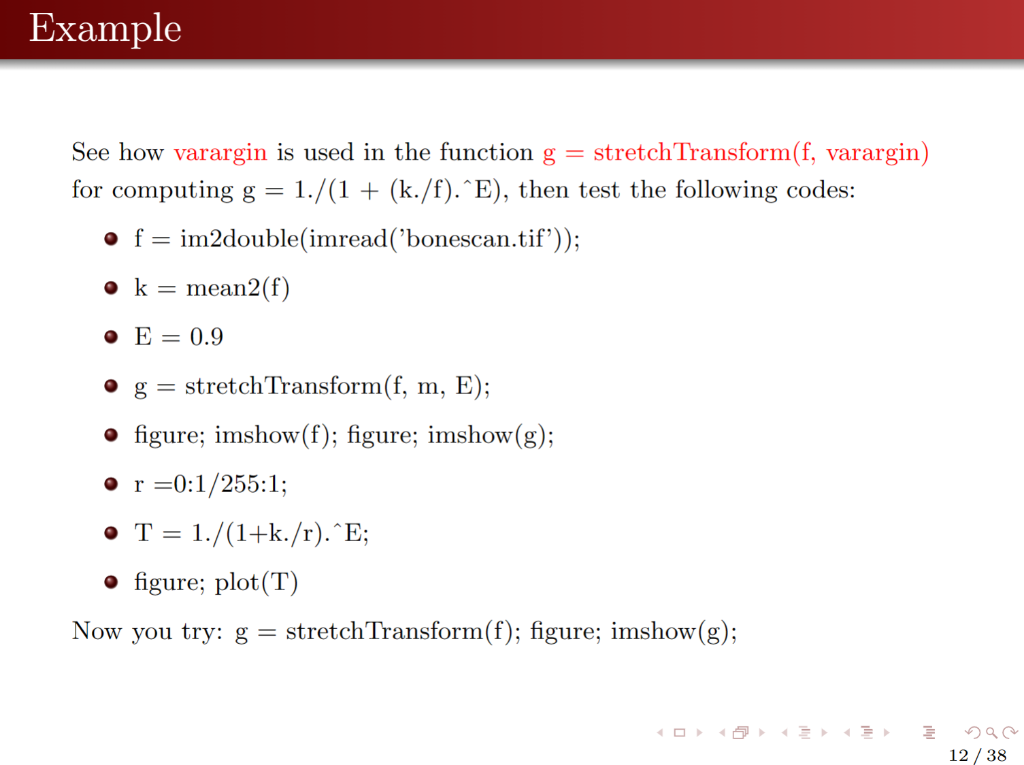
Hint: you might want to use the function: g = stretchTransform(f,varargin)
 In (1) the only free parameter is c, but in (2) there are two parameters, k and E for which values have to be selected. As in most enhancement tasks, experimentation is a must. The objective of this project is to obtain the best visual enhancement possible with the methods in (1) and (2). Once (according to your judgment) you have the best visual result for each transformation, explain the reasons for the major differences between them.
As a minimum, your report should include For problem (1): 1. problem description, your name, date 2. the original image, 3. the enhanced image, 4. What is your pick for the parameter c? 5. all codes you applied
For problem (2): 1. problem description, your name, date 2. the original image, 3. the enhanced image, 4. What is your pick for the two parameters, k and E? 5. all codes you applied
- Tools for dynamic range compression - Logarithmic transformation: g=clog(1+double(f)) Example: - Fourier spectrum has values in the range [0,106]. - If displayed on a monitor, values would be scaled linearly to 8 bits. High values would dominate the display, so visual details would be lost. - Apply log transformation, the dynamic range is [0,14] : loge(106)=6ln(10)=13.8 - Bring values back to [0,255] range: g=im2uint8(mat2gray(g)) 3: Contrast-Stretching Transformations s=T(r)=1+(k/r)E1 - g=1./(1+(k./( double(f) +eps)).E) - Stretch levels is k - E controls the slope of the function T - Expand narrow range of input intensity
Step by Step Solution
There are 3 Steps involved in it

Get step-by-step solutions from verified subject matter experts