

Question: i. Retrieve the data and submit the Excel file with the data by e-mail. To check if you are retrieving the right things, on January
i. Retrieve the data and submit the Excel file with the data by e-mail. To check if you are retrieving the right things, on January 23, 2017 (which is outside of the sample period you need) S&P 500 closed at 2,265.20, and the 3-month Treasury bill yield stood at 0.51% per year. (10 points) ii. Estimate the market model for your portfolio. What are the alpha of your portfolio and the appraisal ratio? Provide the economic interpretation of the two ratios. (10 points) iii. Compare the performance of your portfolio with historical performance of Fidelity Freedom 2030 fund using the alpha and the appraisal ratio (You can use the alpha and the appraisal ratio of Fidelity Freedom we calculated in class). (10 points) iv. Is your portfolio significantly riskier than Fidelity Freedom (assume that the beta of Fidelity Freedom 2030 is constant, i.e. it is just a number)? Is it more actively managed (look at R-squares)? (10 points) v. Compute and interpret the M 2 measure and the Treynor ratio for your portfolio. (10 points) 2 vi. Go to the website of Kenneth French and download the data on the daily returns to SMB, HML, and the momentum factor (unfortunately the data is available only for January, so for the next three questions limit your sample to April only). Add these data to the Excel file you submit by e-mail. (5 points) vii. Compute the correlation between returns to your portfolio and the returns to the momentum factor. Does it look like you were ignoring or even shorting past losers in January? (5 points) viii. Redo (ii) using the data from January only. Given the result in (vii), does it look like the alpha overestimates or underestimates your stock-picking ability? Give two variants of the answer: using the historical evidence on the profitability of the mo- mentum strategy and using the performance of this strategy in January. (15 points) ix. Estimate the Carhart model for the daily return to your portfolio. What does it say about whether you seem to be buying large or small stocks? Value or growth stocks? Based on your actual holdings, do you agree with this assessment? (15 points) x. What does the Carhart model conclude about your stock-picking ability? What is the maximum expense ratio you can charge as a mutual fund manager? (A negative number is acceptable as the expense ratio if you feel that you will need to be paying your investors for letting you train using their money). (Hint: remember that the expense ratio is being charged once a year). (10 points)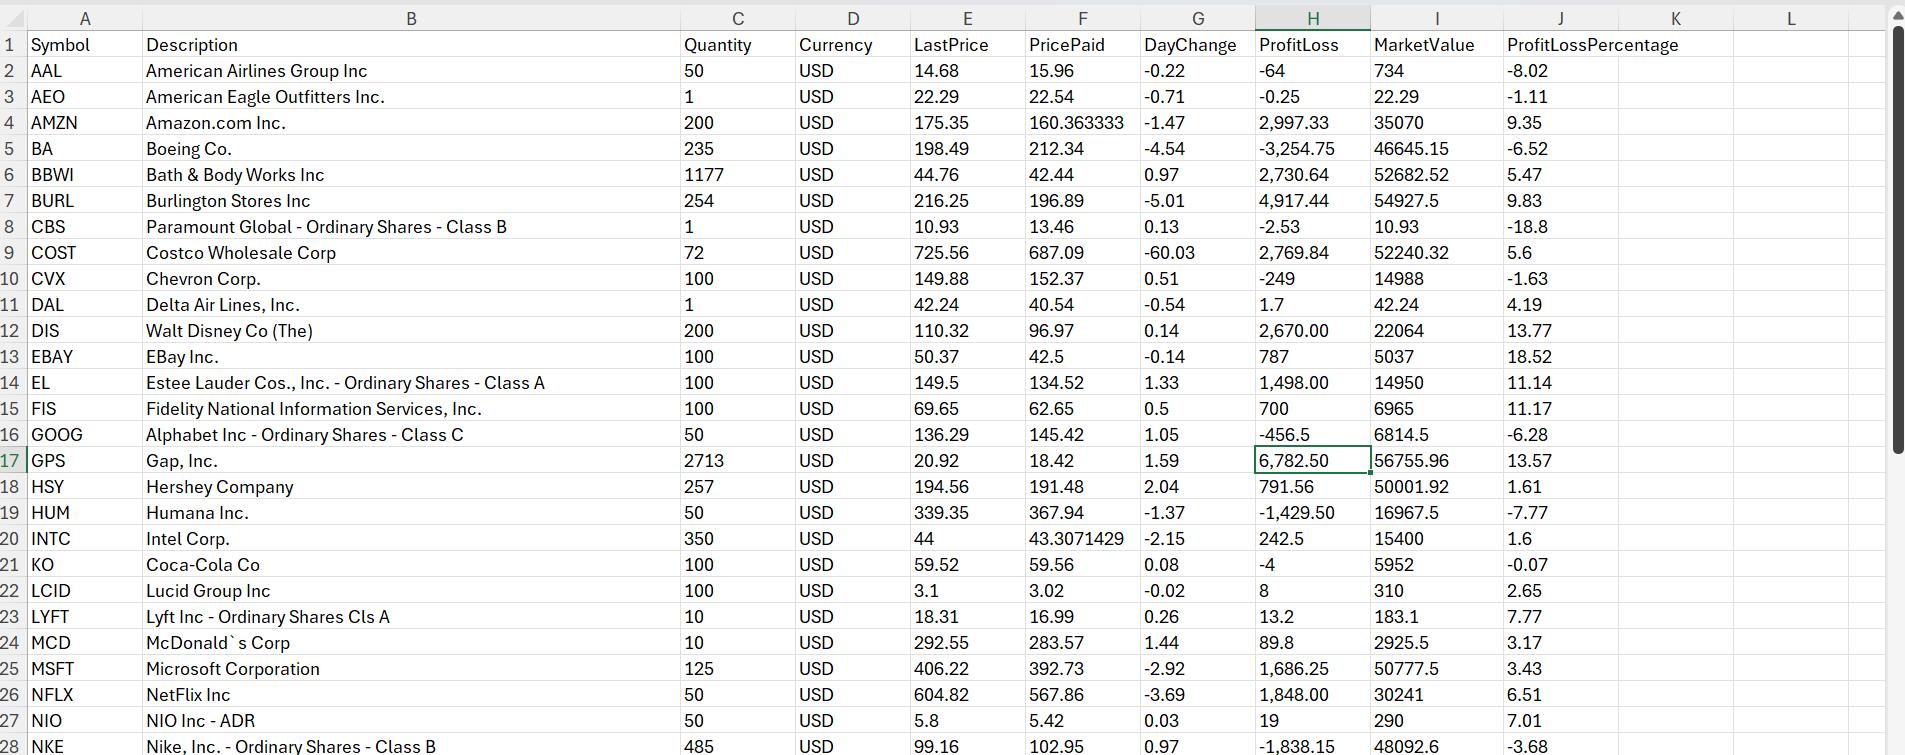
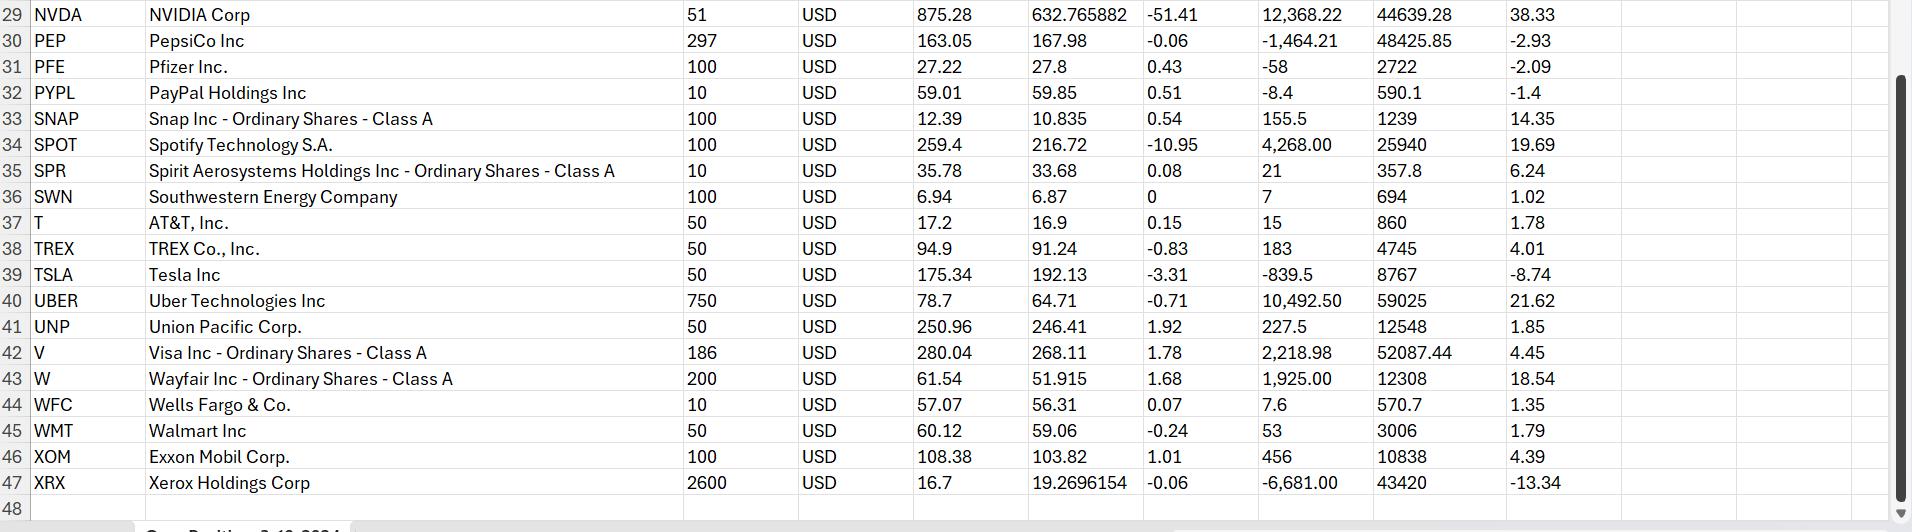
A 1 Symbol Description 2 AAL B C D E F G H K L Quantity Currency LastPrice PricePaid DayChange ProfitLoss MarketValue ProfitLoss Percentage 4 3 AEO AMZN 5 BA 6 BBWI American Airlines Group Inc American Eagle Outfitters Inc. Amazon.com Inc. Boeing Co. Bath & Body Works Inc 50 USD 14.68 15.96 1 USD 22.29 22.54 -0.22 -0.71 -64 -0.25 734 22.29 -8.02 -1.11 200 USD 175.35 160.363333 -1.47 2,997.33 35070 9.35 235 USD 198.49 212.34 -4.54 -3,254.75 46645.15 -6.52 1177 USD 44.76 42.44 0.97 2,730.64 52682.52 5.47 7 BURL Burlington Stores Inc 254 USD 216.25 196.89 -5.01 4,917.44 54927.5 9.83 8 CBS Paramount Global - Ordinary Shares - Class B 1 USD 10.93 13.46 0.13 -2.53 10.93 -18.8 9 COST Costco Wholesale Corp 72 USD 725.56 687.09 -60.03 2,769.84 52240.32 5.6 10 CVX Chevron Corp. 100 USD 149.88 152.37 0.51 -249 14988 -1.63 11 DAL Delta Air Lines, Inc. 1 USD 42.24 40.54 -0.54 1.7 42.24 4.19 12 DIS Walt Disney Co (The) 200 USD 110.32 96.97 0.14 2,670.00 22064 13.77 13 EBAY EBay Inc. 100 USD 50.37 42.5 -0.14 787 5037 18.52 14 EL Estee Lauder Cos., Inc. - Ordinary Shares - Class A 100 USD 149.5 134.52 1.33 1,498.00 14950 11.14 15 FIS Fidelity National Information Services, Inc. 100 USD 69.65 62.65 0.5 700 6965 11.17 16 GOOG Alphabet Inc - Ordinary Shares - Class C 50 USD 136.29 145.42 1.05 -456.5 6814.5 -6.28 17 GPS Gap, Inc. 2713 USD 20.92 18.42 1.59 6,782.50 56755.96 13.57 18 HSY Hershey Company 257 USD 194.56 191.48 2.04 791.56 50001.92 1.61 19 HUM 20 INTC Humana Inc. Intel Corp. 50 USD 339.35 367.94 -1.37 -1,429.50 16967.5 -7.77 350 USD 44 43.3071429 -2.15 242.5 15400 1.6 21 KO Coca-Cola Co 100 USD 59.52 59.56 0.08 -4 5952 -0.07 22 LCID Lucid Group Inc 100 USD 3.1 3.02 -0.02 8 310 2.65 23 LYFT Lyft Inc - Ordinary Shares Cls A 10 USD 18.31 16.99 0.26 13.2 183.1 7.77 24 MCD McDonald's Corp 10 USD 292.55 283.57 1.44 89.8 2925.5 3.17 25 MSFT Microsoft Corporation 125 USD 406.22 392.73 -2.92 1,686.25 50777.5 3.43 26 NFLX NetFlix Inc 50 USD 604.82 567.86 -3.69 1,848.00 30241 6.51 27 NIO NIO Inc - ADR 50 USD 5.8 5.42 0.03 19 290 7.01 28 NKE Nike, Inc. - Ordinary Shares - Class B 485 USD 99.16 102.95 0.97 -1,838.15 48092.6 -3.68
Step by Step Solution
There are 3 Steps involved in it

Get step-by-step solutions from verified subject matter experts