

Question: Implement in Rstudio and please include code. This was all I was given. The astericks just say what we've been doing in class to help
Implement in Rstudio and please include code. This was all I was given. The astericks just say what we've been doing in class to help out with solving the problem.
*To help with what is being asked, this needs to be done in R because you're supposed to input the library(ISLR) and data(Wage) into the script.
**Part A is talking about predictors (age, maritl, race, education, and jobclass) being significant or not in relation to the response variable (Wage) and running a summary of it in Rstudio.
***Other things we've been going over that pertain to this question are model diagnostics (non-linearity, collinearity, heteroskedasticity, outliers, and high leverage points), logwages, and multiple linear regression models
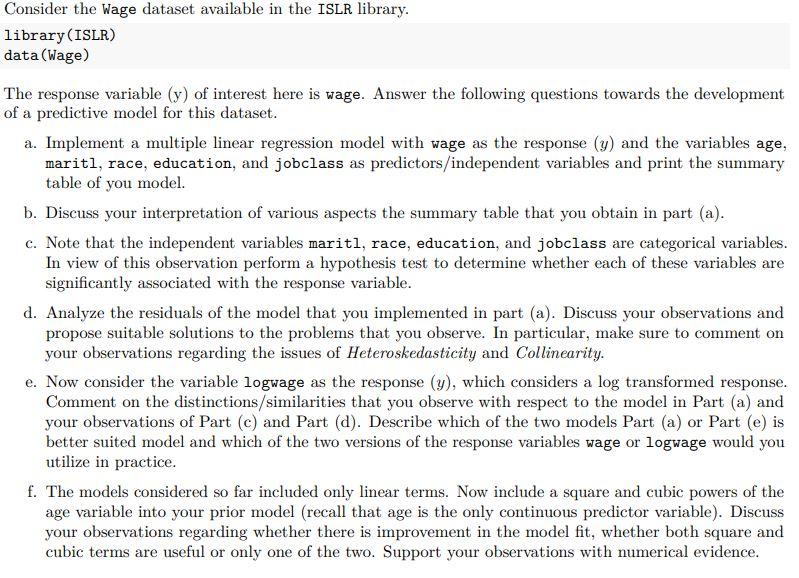
Consider the Wage dataset available in the ISLR library. library (ISLR) data (Wage) The response variable (y) of interest here is wage. Answer the following questions towards the development of a predictive model for this dataset. a. Implement a multiple linear regression model with wage as the response (y) and the variables age, mariti, race, education, and jobclass as predictors/independent variables and print the summary table of you model. b. Discuss your interpretation of various aspects the summary table that you obtain in part (a). c. Note that the independent variables mariti, race, education, and jobclass are categorical variables. In view of this observation perform a hypothesis test to determine whether each of these variables are significantly associated with the response variable. d. Analyze the residuals of the model that you implemented in part (a). Discuss your observations and propose suitable solutions to the problems that you observe. In particular, make sure to comment on your observations regarding the issues of Heteroskedasticity and Collinearity. e. Now consider the variable logwage as the response (y), which considers a log transformed response. Comment on the distinctions/similarities that you observe with respect to the model in Part (a) and your observations of Part (c) and Part (d). Describe which of the two models Part (a) or Part (e) is better suited model and which of the two versions of the response variables wage or logwage would you utilize in practice. f. The models considered so far included only linear terms. Now include a square and cubic powers of the age variable into your prior model (recall that age is the only continuous predictor variable). Discuss your observations regarding whether there is improvement in the model fit, whether both square and cubic terms are useful or only one of the two. Support your observations with numerical evidence. Consider the Wage dataset available in the ISLR library. library (ISLR) data (Wage) The response variable (y) of interest here is wage. Answer the following questions towards the development of a predictive model for this dataset. a. Implement a multiple linear regression model with wage as the response (y) and the variables age, mariti, race, education, and jobclass as predictors/independent variables and print the summary table of you model. b. Discuss your interpretation of various aspects the summary table that you obtain in part (a). c. Note that the independent variables mariti, race, education, and jobclass are categorical variables. In view of this observation perform a hypothesis test to determine whether each of these variables are significantly associated with the response variable. d. Analyze the residuals of the model that you implemented in part (a). Discuss your observations and propose suitable solutions to the problems that you observe. In particular, make sure to comment on your observations regarding the issues of Heteroskedasticity and Collinearity. e. Now consider the variable logwage as the response (y), which considers a log transformed response. Comment on the distinctions/similarities that you observe with respect to the model in Part (a) and your observations of Part (c) and Part (d). Describe which of the two models Part (a) or Part (e) is better suited model and which of the two versions of the response variables wage or logwage would you utilize in practice. f. The models considered so far included only linear terms. Now include a square and cubic powers of the age variable into your prior model (recall that age is the only continuous predictor variable). Discuss your observations regarding whether there is improvement in the model fit, whether both square and cubic terms are useful or only one of the two. Support your observations with numerical evidence
Step by Step Solution
There are 3 Steps involved in it

Get step-by-step solutions from verified subject matter experts