

Question: import CSV import matp Lot Lib . pyplot as pit data = [ ] with open ( ' attack_ type_ frequency . CSV' ,' r')
![= [ ] with open ( ' attack_ type_ frequency . CSV'](https://dsd5zvtm8ll6.cloudfront.net/si.experts.images/questions/2024/10/670f651a8ffbe_170670f651a7b820.jpg)
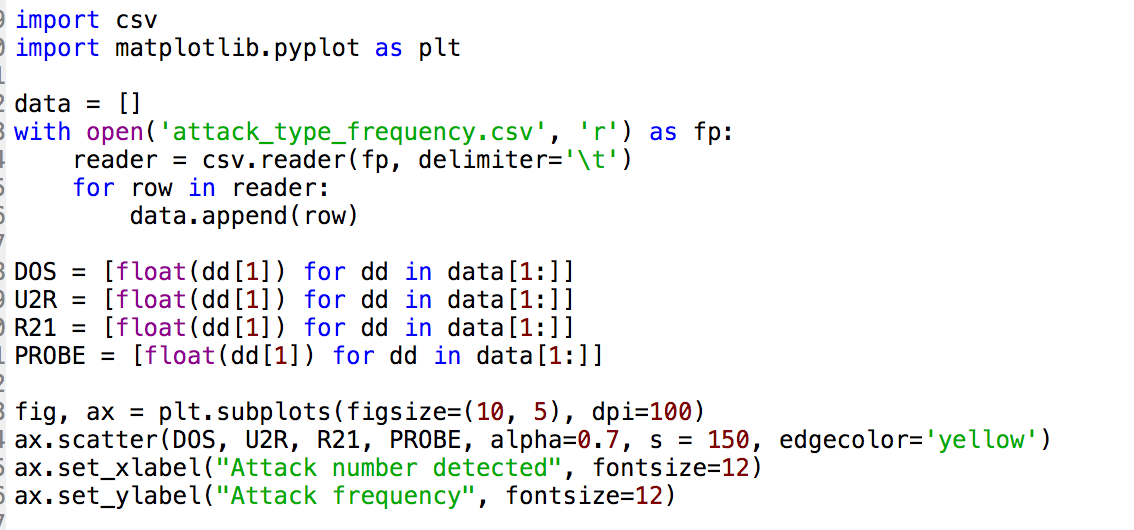
import CSV import matp Lot Lib . pyplot as pit data = [ ] with open ( ' attack_ type_ frequency . CSV' ,' r') as to : reader = csV . reader ( fp , deLimiter = ' It ' ) for row in reader : data . append ( row ) DOS = [ float ( dd [ 1 ] ) for ad in data [ 1 : ]] UZR = [ float ( dd [1] ) for ad in data [ 1 : ] ] R 21 = [ float ( dd [ 1 ] ) for ad in data [ 1 : ]] PROBE = [ float ( dd [ 1 ] ) for ad in data [ 1 : ]] fig , ax = pit . subplots ( figsize = ( 10 , 5 ) , dpi = 100 ) ax . scatter(DOS , UZR, R21 , PROBE , alpha = 0 . 7, 5 = 150 , edgecolor=' yellow' ) ax . set_ * label( " Attack number detected " , fontsize = 12 ) ax . set_ y label ( " Attack frequency " , fontsize = 12 )Attack type category number of attack Frequency % apache 2 dos 124 0. 52 back dos 432 1. 8 pod dos 43 0. 18 udpstorm dos 96 0 . 4 PS U21 482 2. 01 buffer overflow U2 5 2625 10. 93 perl U21 954 3.97 rootkit U Zr 679 2.83
Step by Step Solution
There are 3 Steps involved in it

Get step-by-step solutions from verified subject matter experts