

Question: import json import pandas import matplotlib.pyplot as plt def load _ data ( FBI _ CrimeData _ 2 0 1 6 ) : with open
import json
import pandas
import matplotlib.pyplot as plt
def loaddataFBICrimeData:
with openFBICrimeDatar as f:
return json.loadf
def accumcrimeunit crimes, citydictslst:
result
# Convert single crime to list for consistent processing
if isinstancecrimes str:
crimes crimes
# Accumulate counts
for city in citydictslst:
key cityunit
if key not in result:
resultkey
for crime in crimes:
resultkey citycrime
return result
def createcrimesummarycitydictslst:
# Define crime categories
violentcrimes Murder 'Rape', 'Robbery', 'Assault'
nonviolentcrimes Burglary 'Theft', 'VehicleTheft'
# Create summaries
murderbyregion accumcrimeRegion 'Murder', citydictslst
violentbyregion accumcrimeRegion violentcrimes, citydictslst
nonviolentbyregion accumcrimeRegion nonviolentcrimes, citydictslst
return murderbyregion, violentbyregion, nonviolentbyregion
def plotcrimedatadatadict, title, figsize:
# Convert dictionary to dataframe
df pdDataFramelistdatadict.items columnsRegion 'Incidents'
# Define colors for regions
colormap South: 'blue', 'West': 'orange',
'Northeast': 'green', 'Midwest': 'red'
colors colormapregion for region in dfRegion
# Create plot
pltfigurefigsizefigsize
pltbardfRegion dfIncidents colorcolors
plttitletitle
pltxlabelRegion
pltylabelIncidents
# Print data table
printftitle
printdftostringindexTrue
print
pltshow
def createstatesummarycitydictslst:
# Get violent crime totals
violentcrimes Murder 'Rape', 'Robbery', 'Assault'
statecrimes accumcrimeState violentcrimes, citydictslst
# Calculate national average states including DC
nationalavg sumstatecrimes.values
# Create summary with differences
summary
state:
'Crimes': crimes,
'Diff from Avg': roundcrimes nationalavg
for state, crimes in statecrimes.items
# Print formatted table
printf National Average Violent Crime: intnationalavg
print
State Crimes Diff from Avg"
print
for state in sortedsummarykeys:
printfstate:summarystateCrimes:summarystateDiff from Avg':
def mainFBICrimeData:
# Load data
citydictslst loaddataFBICrimeData
# Create and display all visualizations and summaries
murderbyregion, violentbyregion, nonviolentbyregion createcrimesummarycitydictslst
plotcrimedatamurderbyregion, "Murder by Region"
plotcrimedataviolentbyregion, "Violent Crime by Region"
plotcrimedatanonviolentbyregion, "NonViolent Crime by Region"
createstatesummarycitydictslst
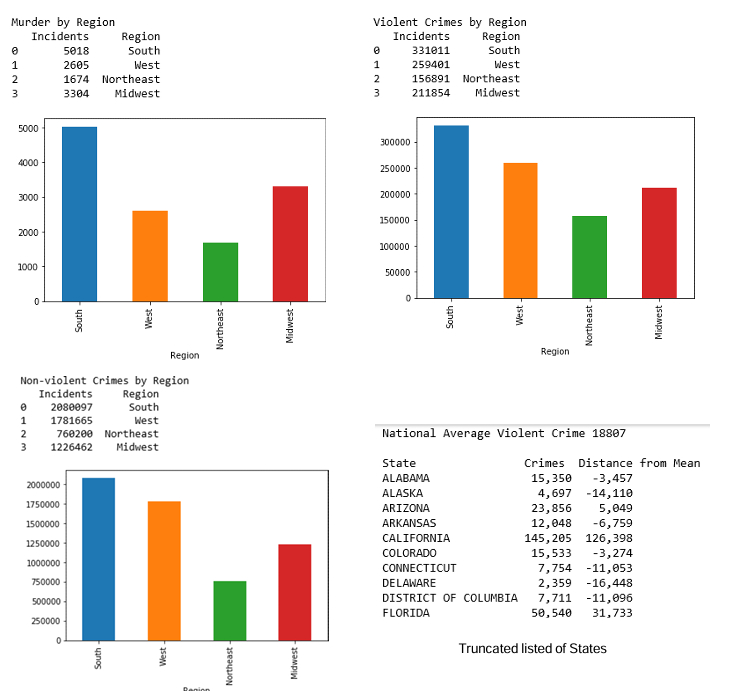
above is my code, its written in python and uploaded as a notebook file in jupyter notebook. The goal is to get an output looking like the photo below minus the flow chart, that is the next step later bar graphs need to be displayed as well as colored, when I run the cell that has the code, I get nothing. No errors, no output, nothing. I've asked this question a few times but I get the answer of using python crimeanalysis.py to output the code, that not only gives me a syntax error but I think it is unnecessary because everything is in one directory AND since its in jupyter, I cant run bash commands.
Finally, below is a snippet from the json file I am pulling information from FBICrimeData
"Region": "South",
"State": "ALABAMA",
"City": "Abbeville",
"Population":
"Murder":
"Rape":
"Robbery":
"Assault":
"Burglary":
"Theft":
"VehicleTheft":
"Region": "South",
"State": "ALABAMA",
"City": "Adamsville",
"Population":
"Murder":
"Rape":
"Robbery":
"Assault":
"Burglary":
"Theft":
"VehicleTheft":
Step by Step Solution
There are 3 Steps involved in it
1 Expert Approved Answer
Step: 1 Unlock

Question Has Been Solved by an Expert!
Get step-by-step solutions from verified subject matter experts
Step: 2 Unlock
Step: 3 Unlock