

Question: import matplotlib.pyplot as plt import numpy as np population = 763 Scur = population -1 # number of people susceptible Icur = 1 # number
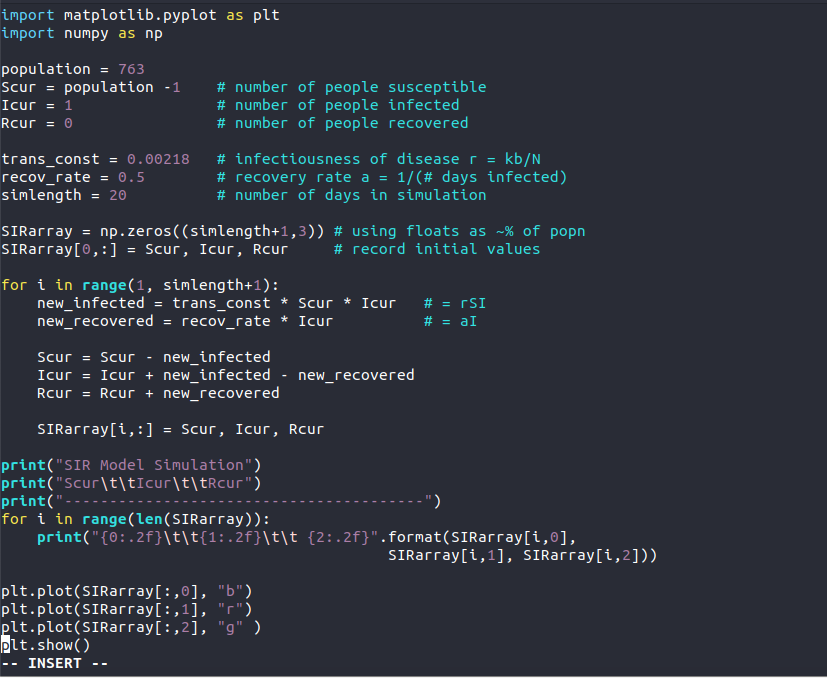
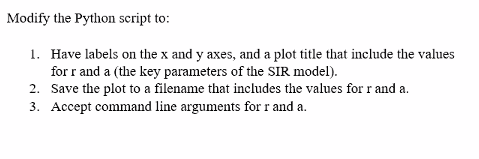
import matplotlib.pyplot as plt import numpy as np population = 763 Scur = population -1 # number of people susceptible Icur = 1 # number of people infected Rcur = 0 # number of people recovered trans_const = 0.00218 # infectiousness of disease r = kb/N recov_rate = 0.5 # recovery rate a = 1/(# days infected) simlength = 20 # number of days in simulation SIRrray = np.zeros((simlength+1,3)) # using floats as -% of popn SIRrray[0,:] = Scur, Icur, Rcur # record initial values for i in range(1, simlength+1): new_infected = trans_const * Scur * Icur # = rSI new_recovered = recov_rate * Icur # = al Scur = Scur - new_infected Icur = Icur + new_infected - new_recovered Rcur = Rcur + new recovered SIRrray[i,:] Scur, Icur, Rour print("SIR Model simulation") print("Scur\t\tIcur\t\tRcur") print("- for i in range(len(SIRrray)): print("{0:.2f}\t\t{1:.2f}\t\t {2:.2f}".format(SIRrray[i,0], SIRrray[i,1], SIRrray[i,2])) plt.plot(SIRrray[:,0], "b") plt.plot(SIRrray[:,1], "r") plt.plot(SIRrray[:,2], "g" ) plt.show() INSERT Modify the Python script to: 1. Have labels on the x and y axes, and a plot title that include the values for r and a (the key parameters of the SIR model). 2. Save the plot to a filename that includes the values for r and a. 3. Accept command line arguments for r and a
Step by Step Solution
There are 3 Steps involved in it

Get step-by-step solutions from verified subject matter experts