

Question: import matplotlib.pyplot as plt # set the color here COLOR = 'blue' def autolabel(rectangle_group): for rect in rectangle_group: height = rect.get_height() ax.annotate(str(height), xy = (rect.get_x()
import matplotlib.pyplot as plt
# set the color here COLOR = 'blue'
def autolabel(rectangle_group): for rect in rectangle_group: height = rect.get_height()
ax.annotate(str(height), xy = (rect.get_x() + rect.get_width() / 2,height), ha = 'center', xytext = (0,3),textcoords = 'offset points', color = 'grey')
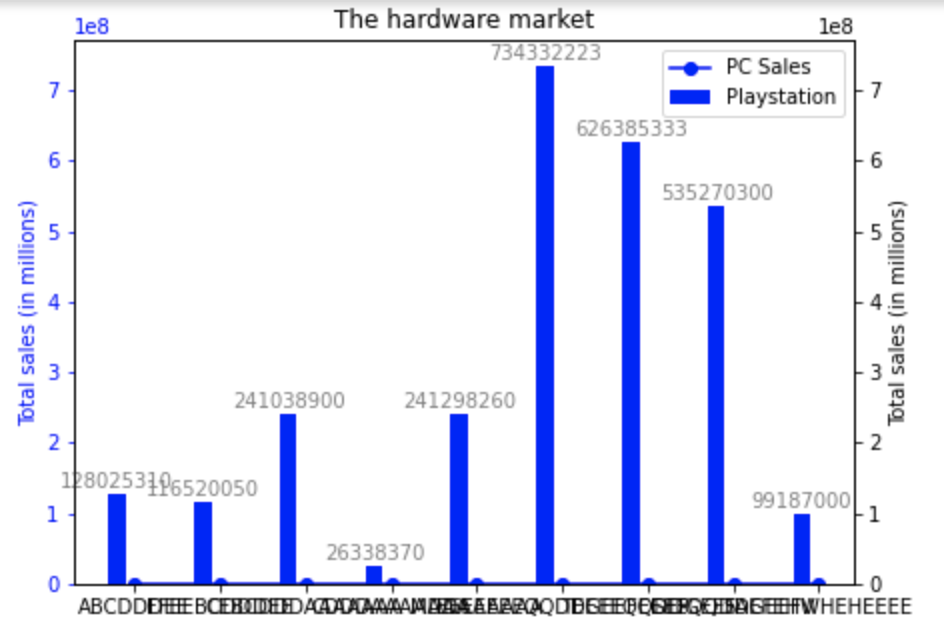
phases = ['ABCDDDEE', 'FFEEBCDDDEE', 'CEBCDDDAAAAAAA', 'CDDDAAAAAAA', 'MDDAAAAAA', 'EEEEEEEQQDDGEEFEGEP', 'TEEEEQQDDGEEF', 'EEEQQDDGEEFV', 'SAEFEHWHEHEEEE'] playstation = [128025310, 116520050, 241038900, 26338370, 241298260, 734332223, 626385333, 535270300, 99187000 ] pc_sales = [0.499088743030168, 0.240923281868178, 0.0660538759431783, 0.0493960725965669, 0.406346654626102, 0.0400699034093881, 0.385682463666874, 0.0992130526364415, 0.32786310400448837 ]
width = 0.2 x_playstation = [x - width for x in range(len(playstation))] x_xbox = [x for x in range(len(playstation))] x_nintendo = [x + width for x in range(len(playstation))]
fig,ax = plt.subplots(figsize=(7,5))
rect1 = ax.bar(x_playstation, playstation,width, label = 'Playstation',color = COLOR) ax.plot(phases,pc_sales,label = 'PC Sales',color = COLOR,marker = 'o')
# set the color of y-axis ax.yaxis.label.set_color(COLOR) ax.tick_params(axis='y', colors=COLOR)
ax.set_title('The hardware market') ax.set_ylabel('Total sales (in millions)')
# set y-axis on the right side ax2 = ax.twinx()
# set y-range ax2.set_ylim(ax.get_ylim())
# set y label ax2.set_ylabel('Total sales (in millions)')
ax.legend() autolabel(rect1) plt.show()
How to widen X-axis to make visible categories?
Also, how to change the unit of the Y-axis for the line graph (as the number in the line graph is small, it's not visible on the graph)
And, how to change the colour of the bar or line graph which align with the colour of each y-axis? (one for blue and one for black)
le8 The hardware market 734332223 le8 7 PC Sales Playstation 7 626385333 6 6 535270300 5 5 4 4 Total sales (in millions) Total sales (in millions) 3 241038900 241298260 2 2 180253186520050 1 99187000 -1 26338370 0 0 ABCDDERIE BCERDEID AADADAMAMA ALPEAQDBEERBEETGEHEEWHEHEEEE
Step by Step Solution
There are 3 Steps involved in it

Get step-by-step solutions from verified subject matter experts