

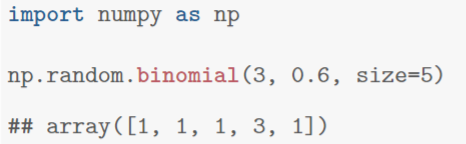
Question: import numpy as np np.random.binomial (3, 0.6, size=5) ## array([1, 1, 1, 3, 1]) plt.hist(x) plt.scatter (successes, counts, c=red) 1 (log x-)2 fx(x) =
![3, 1]) plt.hist(x) plt.scatter (successes, counts, c="red") 1 (log x-)2 fx(x) =](https://s3.amazonaws.com/si.experts.images/answers/2024/05/6647e366d1752_3026647e366bd1bb.jpg)
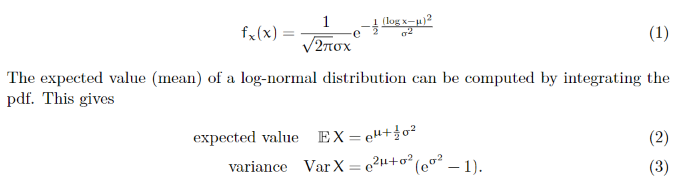
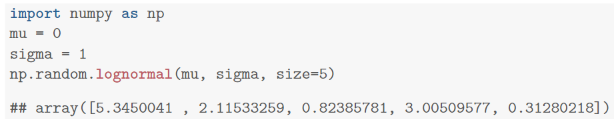
import numpy as np np.random.binomial (3, 0.6, size=5) ## array([1, 1, 1, 3, 1]) plt.hist(x) plt.scatter (successes, counts, c="red") 1 (log x-)2 fx(x) = 02 2 (1) The expected value (mean) of a log-normal distribution can be computed by integrating the pdf. This gives expected value EX = "+0 variance Var X=2+02 (002 -1). (2) (3) import numpy as np mu = 0 sigma = 1 np.random.lognormal (mu, sigma, size=5) ## array([5.3450041 2.11533259, 0.82385781, 3.00509577, 0.31280218]) '
Step by Step Solution
There are 3 Steps involved in it
1 Expert Approved Answer
Step: 1 Unlock

Question Has Been Solved by an Expert!
Get step-by-step solutions from verified subject matter experts
Step: 2 Unlock
Step: 3 Unlock