

Question: Import the dataset and run a Point - Biserial Correlation between and the column This is the thickness of the subiculum subregion of the medial
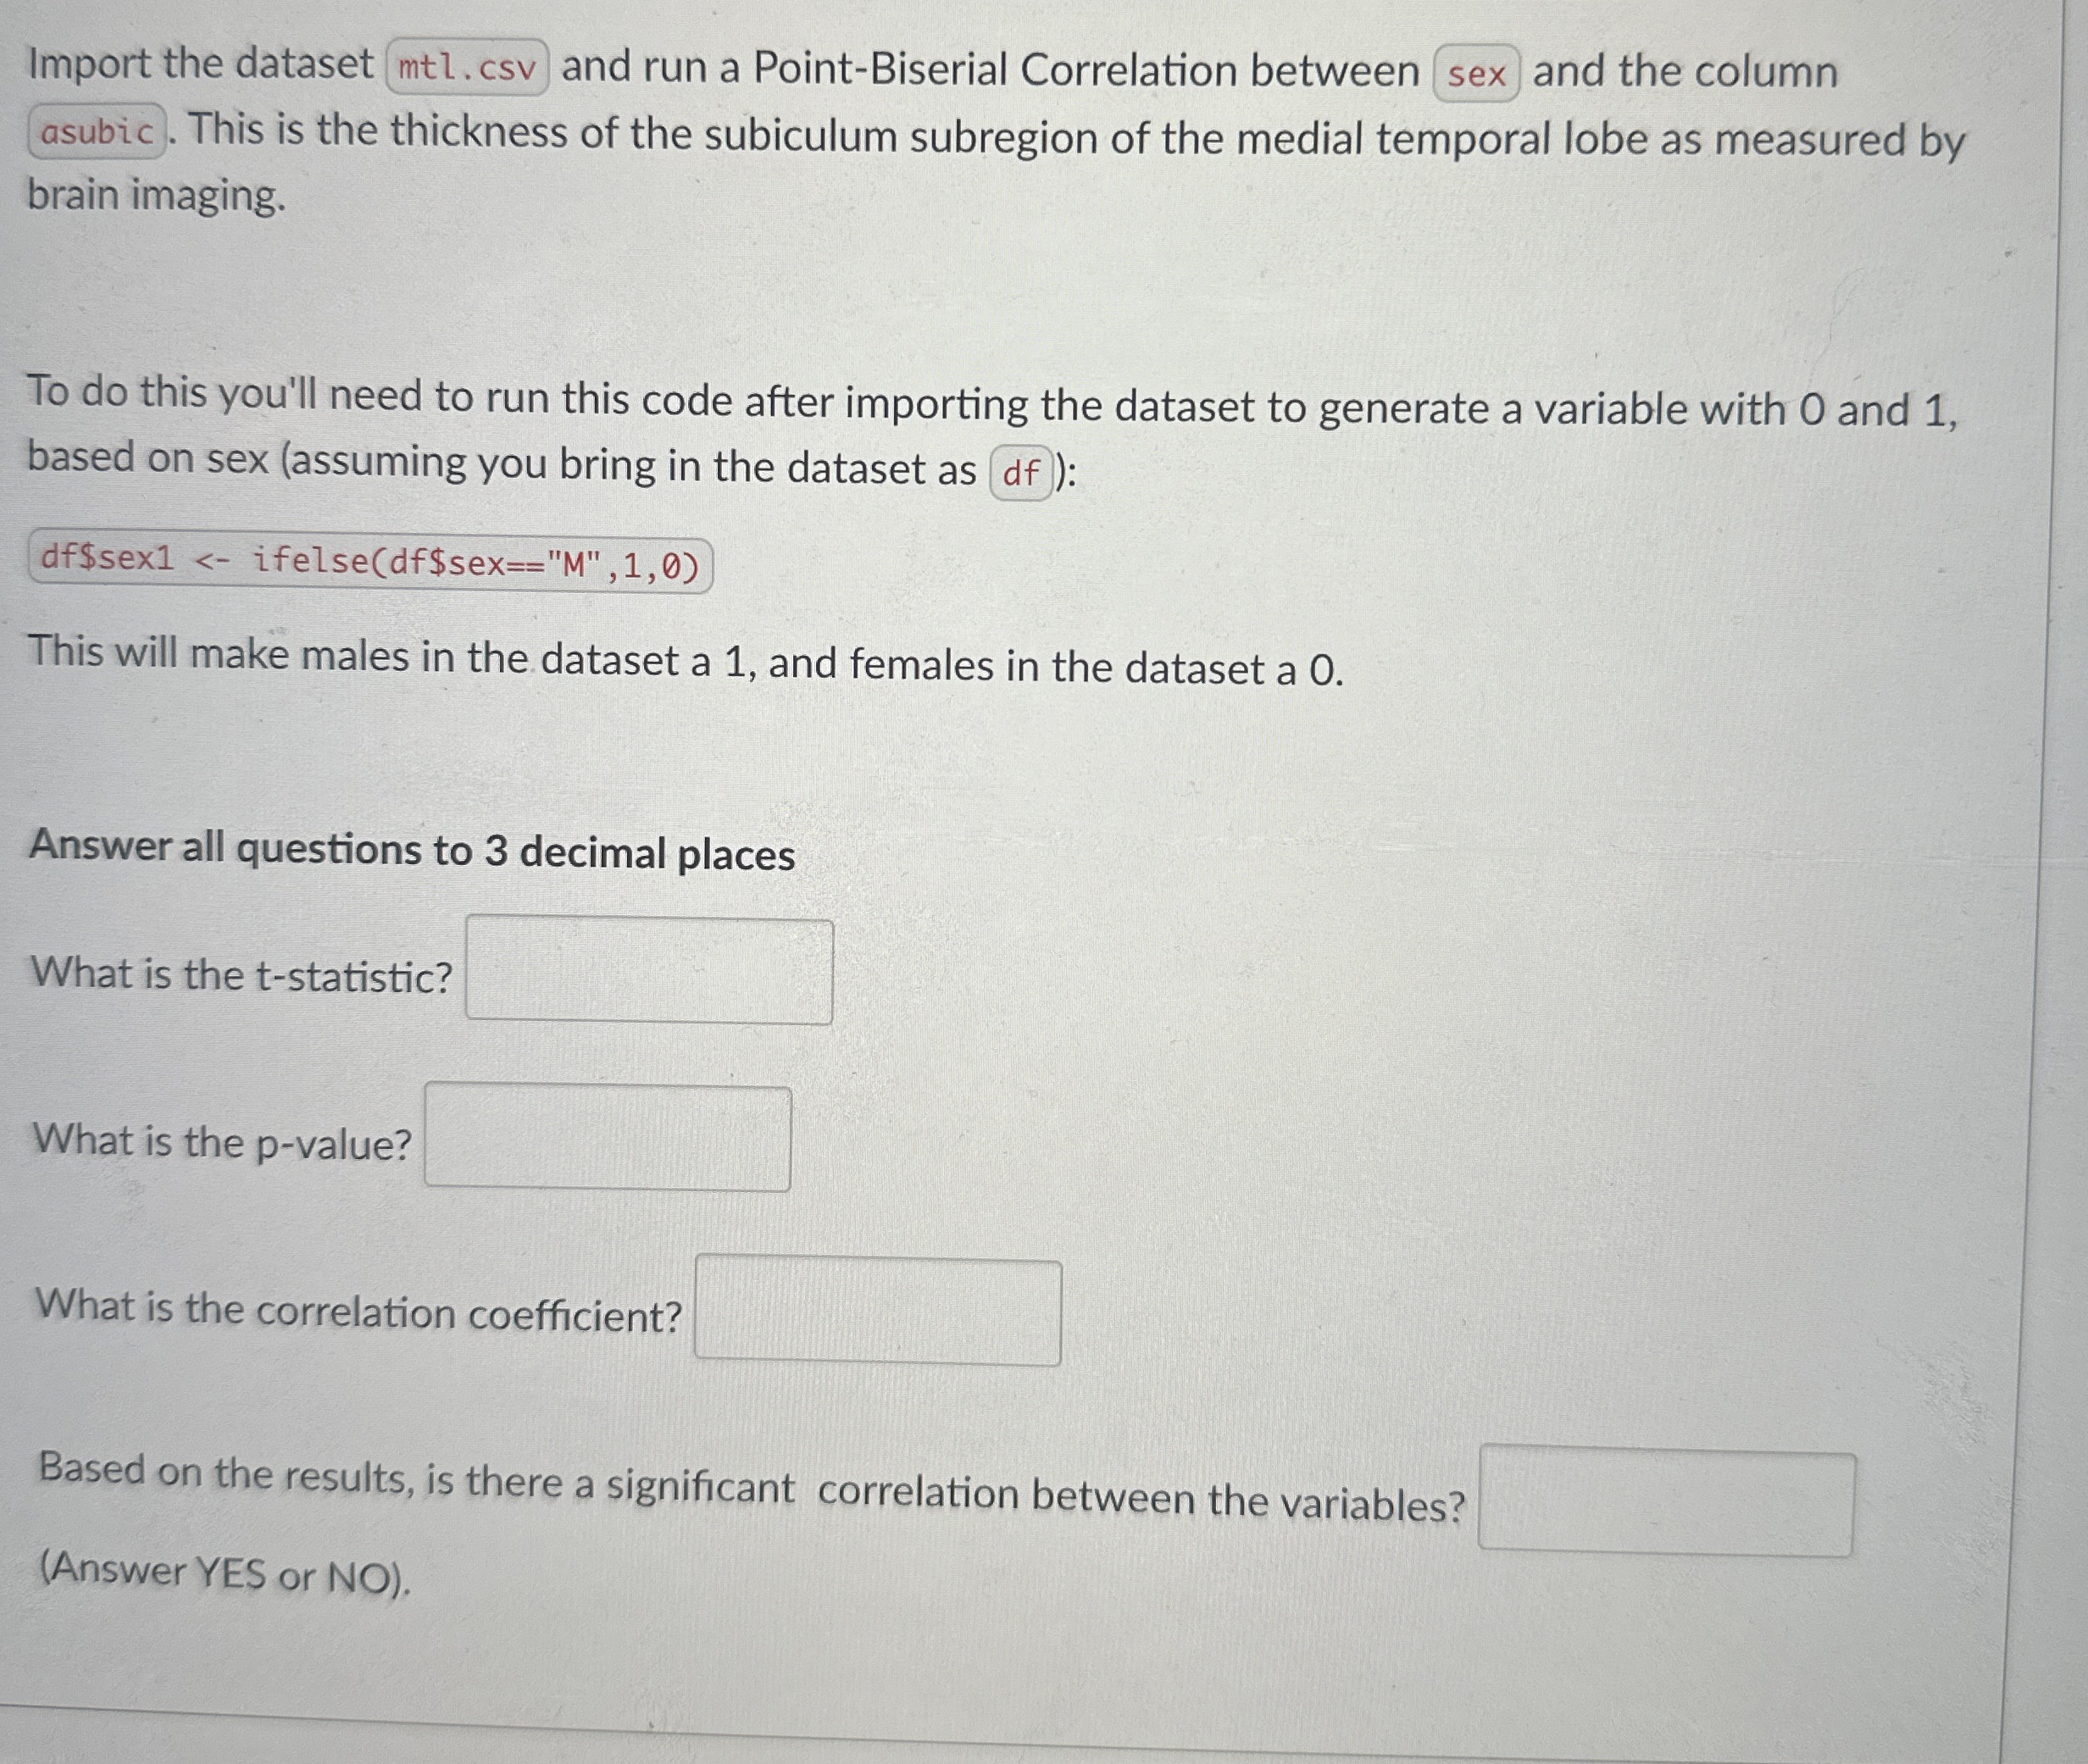
Import the dataset and run a PointBiserial Correlation between and the column
This is the thickness of the subiculum subregion of the medial temporal lobe as measured by brain imaging.
To do this you'll need to run this code after importing the dataset to generate a variable with and based on sex assuming you bring in the dataset as
This will make males in the dataset a and females in the dataset a
Answer all questions to decimal places
What is the tstatistic?
What is the value?
What is the correlation coefficient?
Based on the results, is there a significant correlation between the variables?
Answer YES or NO
Step by Step Solution
There are 3 Steps involved in it
1 Expert Approved Answer
Step: 1 Unlock

Question Has Been Solved by an Expert!
Get step-by-step solutions from verified subject matter experts
Step: 2 Unlock
Step: 3 Unlock