

Question: In 1 9 7 4 , the Safe Drinking Water Act was passed to protect public health by regulating the nation's public drinking water
In the Safe Drinking Water Act was passed to protect public health by regulating the nation's public drinking water supply." In accordance with the act, the Environmental Protection Agency EPA has regulations that limit the levels of contaminants in drinking water supplied by water utilities. These utilities are required to supply water quality reports to their customers annually. These reports discuss the source of the water, its treatment, and the results of water quality monitoring that is performed daily. The results of this monitoring indicate whether or not drinking water is healthy enough for consumption.
A water department tests for contaminants at water treatment plants and at customers' taps These regulated parameters include microorganisms, organic chemicals, and inorganic chemicals. For instance, cyanide is an inorganic chemical that is regulated. Its presence in drinking water is the result of discharges from steel, plastics, and fertilizer factories. The maximum contaminant level for cyanide is set at part per million.
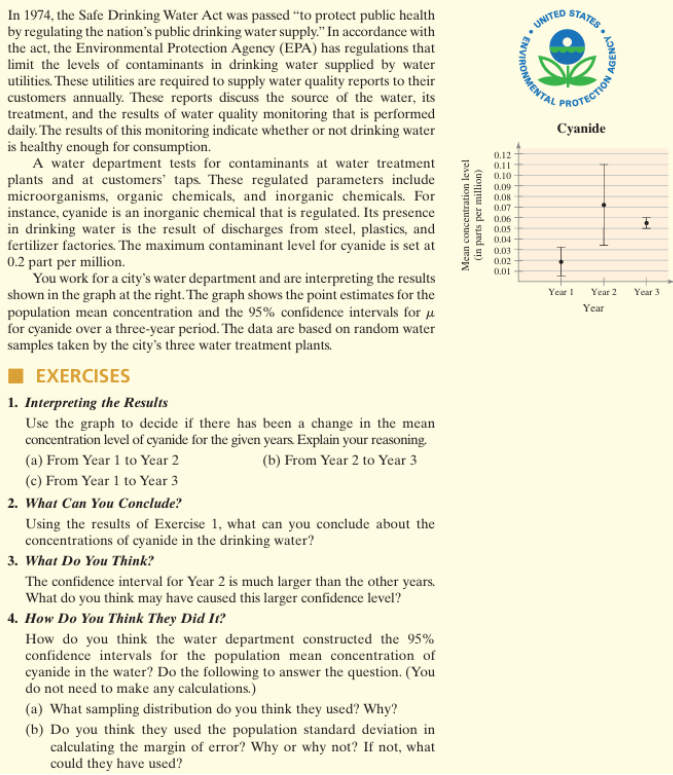
You work for a city's water department and are interpreting the results shown in the graph at the right. The graph shows the point estimates for the population mean concentration and the confidence intervals for for cyanide over a threeyear period. The data are based on random water samples taken by the city's three water treatment plants.
EXERCISES
Interpreting the Results
Use the graph to decide if there has been a change in the mean concentration level of cyanide for the given years. Explain your reasoning.
a From Year to Year
b From Year to Year
c From Year to Year
What Can You Conclude?
Using the results of Exercise what can you conclude about the concentrations of cyanide in the drinking water?
What Do You Think?
The confidence interval for Year is much larger than the other years. What do you think may have caused this larger confidence level?
How Do You Think They Did It
How do you think the water department constructed the confidence intervals for the population mean concentration of cyanide in the water? Do the following to answer the question. You do not need to make any calculations.
a What sampling distribution do you think they used? Why?
b Do you think they used the population standard deviation in calculating the margin of error? Why or why not? If not, what could they have used?
Step by Step Solution
There are 3 Steps involved in it
1 Expert Approved Answer
Step: 1 Unlock

Question Has Been Solved by an Expert!
Get step-by-step solutions from verified subject matter experts
Step: 2 Unlock
Step: 3 Unlock