

Question: In 141: import numpy - np. This is a line comment, use them to explain what a line of code does. We renamed the numpy
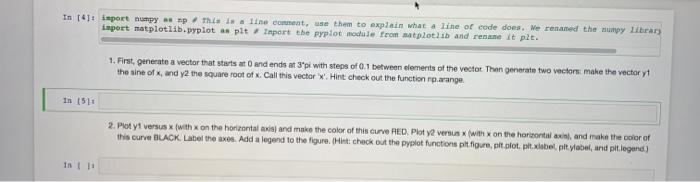
In 141: import numpy - np. This is a line comment, use them to explain what a line of code does. We renamed the numpy library import matplotlib.pyplot as plt. Import the pyplot module from matplotib and rename It plt. 1. First, generate a vector that starts at and ends at 3pl with steps of 0.1 between elements of the vector Than generate two vectors make the vectory+ the sine of , and y2 the square root of x. Call this vector .Hint check out the function parange. 2. Ploty versus x with x on the horizontal axis and make the color of this curve RED. Ploty versus with x on the horisontalain, and make the color of this curve BLACK Label the bes. Add a legend to the figure. (Hints check out the pyplot functions pit figure pit olot, pitxobel pitylabel, and it legend) 18 18
Step by Step Solution
There are 3 Steps involved in it

Get step-by-step solutions from verified subject matter experts