

In 2011 the government of Israel decided to abandon price supervision of cottage cheese. As a...
Fantastic news! We've Found the answer you've been seeking!
Question:

Transcribed Image Text:
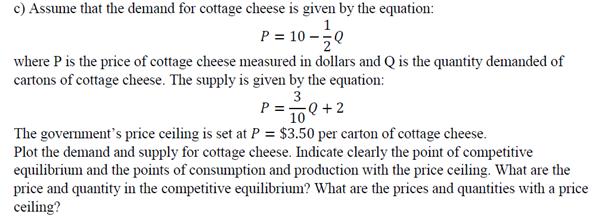
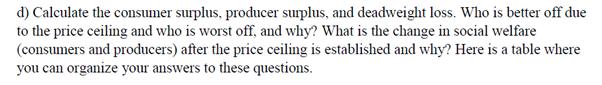
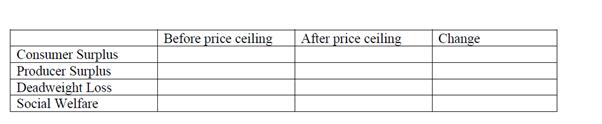
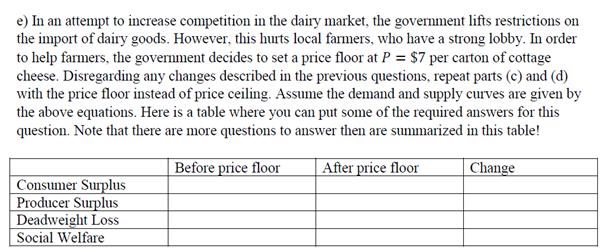
In 2011 the government of Israel decided to abandon price supervision of cottage cheese. As a result, the price of cottage cheese jumped, causing public protests and widespread riots against the government. After public pressure, the government reinstated a price ceiling on cottage cheese. a) Assume the demand for cottage cheese is a downward sloping line (that is, as price increases the quantity demanded of cottage cheese decreases holding everything else constant), and the supply of cottage cheese is an upward sloping line (that is, as price increases the quantity | supplied of cottage cheese increases holding everything else constant). Plot the demand and supply curves for cottage cheese in a graph measuring the quantity of cottage cheese on the horizontal axis and the price of cottage cheese on the vertical axis. Mark the equilibrium price in this market (assume it is a competitive market) as P₁ and the equilibrium quantity in this market as Q₁. On the same graph, indicate how a price ceiling would change the quantities demanded and supplied and the prices consumers and producers face. Mark the price ceiling price as P2 and the price ceiling quantity as Q2. b) What are the changes in consumer surplus, producer surplus and total welfare (in this example, total welfare = consumer surplus + producer surplus)? c) Assume that the demand for cottage cheese is given by the equation: P = 10-10 where P is the price of cottage cheese measured in dollars and Q is the quantity demanded of cartons of cottage cheese. The supply is given by the equation: 3 P ==Q+2 10 The government's price ceiling is set at P = $3.50 per carton of cottage cheese. Plot the demand and supply for cottage cheese. Indicate clearly the point of competitive equilibrium and the points of consumption and production with the price ceiling. What are the price and quantity in the competitive equilibrium? What are the prices and quantities with a price ceiling? d) Calculate the consumer surplus, producer surplus, and deadweight loss. Who is better off due to the price ceiling and who is worst off, and why? What is the change in social welfare (consumers and producers) after the price ceiling is established and why? Here is a table where you can organize your answers to these questions. Consumer Surplus Producer Surplus Deadweight Loss Social Welfare Before price ceiling After price ceiling Change e) In an attempt to increase competition in the dairy market, the government lifts restrictions on the import of dairy goods. However, this hurts local farmers, who have a strong lobby. In order to help farmers, the government decides to set a price floor at P = $7 per carton of cottage cheese. Disregarding any changes described in the previous questions, repeat parts (c) and (d) with the price floor instead of price ceiling. Assume the demand and supply curves are given by the above equations. Here is a table where you can put some of the required answers for this question. Note that there are more questions to answer then are summarized in this table! After price floor Change Consumer Surplus Producer Surplus Deadweight Loss Social Welfare Before price floor In 2011 the government of Israel decided to abandon price supervision of cottage cheese. As a result, the price of cottage cheese jumped, causing public protests and widespread riots against the government. After public pressure, the government reinstated a price ceiling on cottage cheese. a) Assume the demand for cottage cheese is a downward sloping line (that is, as price increases the quantity demanded of cottage cheese decreases holding everything else constant), and the supply of cottage cheese is an upward sloping line (that is, as price increases the quantity | supplied of cottage cheese increases holding everything else constant). Plot the demand and supply curves for cottage cheese in a graph measuring the quantity of cottage cheese on the horizontal axis and the price of cottage cheese on the vertical axis. Mark the equilibrium price in this market (assume it is a competitive market) as P₁ and the equilibrium quantity in this market as Q₁. On the same graph, indicate how a price ceiling would change the quantities demanded and supplied and the prices consumers and producers face. Mark the price ceiling price as P2 and the price ceiling quantity as Q2. b) What are the changes in consumer surplus, producer surplus and total welfare (in this example, total welfare = consumer surplus + producer surplus)? c) Assume that the demand for cottage cheese is given by the equation: P = 10-10 where P is the price of cottage cheese measured in dollars and Q is the quantity demanded of cartons of cottage cheese. The supply is given by the equation: 3 P ==Q+2 10 The government's price ceiling is set at P = $3.50 per carton of cottage cheese. Plot the demand and supply for cottage cheese. Indicate clearly the point of competitive equilibrium and the points of consumption and production with the price ceiling. What are the price and quantity in the competitive equilibrium? What are the prices and quantities with a price ceiling? d) Calculate the consumer surplus, producer surplus, and deadweight loss. Who is better off due to the price ceiling and who is worst off, and why? What is the change in social welfare (consumers and producers) after the price ceiling is established and why? Here is a table where you can organize your answers to these questions. Consumer Surplus Producer Surplus Deadweight Loss Social Welfare Before price ceiling After price ceiling Change e) In an attempt to increase competition in the dairy market, the government lifts restrictions on the import of dairy goods. However, this hurts local farmers, who have a strong lobby. In order to help farmers, the government decides to set a price floor at P = $7 per carton of cottage cheese. Disregarding any changes described in the previous questions, repeat parts (c) and (d) with the price floor instead of price ceiling. Assume the demand and supply curves are given by the above equations. Here is a table where you can put some of the required answers for this question. Note that there are more questions to answer then are summarized in this table! After price floor Change Consumer Surplus Producer Surplus Deadweight Loss Social Welfare Before price floor
Expert Answer:

Related Book For 

Posted Date:
Students also viewed these accounting questions
-
Assume the demand for product A is perfectly inelastic. Further, assume that the buyers of product A get the funds to pay for it by stealing. (a) If the supply of A decreases, what happens to its...
-
Assume that demand for a commodity is represented by the equation P = 10 .2Qd and supply by the equation P = 2 + .2Qs, where Qd and Qs are quantity demanded and quantity supplied, respectively, and...
-
How would the equilibrium price and quantity change in the market depicted below if the marginal cost of every producer were to increase by $2/lb? Price (S/Ab Quantity ilb/day) 0
-
Generally, the JDBC API perform the following three functions a. Connect to database, load JDBC driver, perform the query b. Perform the query, connect to database, load JDBC driver c. Get result...
-
Helical Products, Inc. uses an after-tax MARR of 12% per year. If the company's effective tax rate (federal, state, and local taxes) is 40%, determine the company's before-tax MARR.
-
Find the slope and y-intercept of each line, and graph it. y = 3x - 1
-
If \(A\) and \(B\) are mutually exclusive events, \(P(A)=0.45\), and \(P(B)=0.30\), find (a) \(P(\bar{A})\); (b) \(P(A \cup B)\); (c) \(P(A \cap \bar{B})\); (d) \(P(\bar{A} \cap \bar{B})\).
-
Yankee Co.'s property, plant, and equipment and accumulated depreciation and amortization balances at December 31, Year 4, are Asset Cost Accumulated Depreciation Land $ 275,000 -- Buildings...
-
Adjustment for Uncollectible Accounts Below is the aging of receivables schedule for Evers Industries. Aging-of-Receivables Schedule November 30 Not 1-30 31-60 61-90 Over 90 Past Days Days Customer...
-
During the boom years of 2010-2014, ace mutual fund manager Diana Sauros produced the following percentage rates of return. Rates of return on the market are given for comparison. Calculate the...
-
SECTION A (60 MARKS) Answer ALL the following questions. You may use books, online journals/articles/ magazines as references to support you answer. CASE: General Electric (GE), The New Face of...
-
What are the steps in applying for, obtaining, and maintaining an insurance policy?
-
What are the duties that a principal has in relation to an agent?
-
What is the source of the U.S. fiscal imbalance and what are the painful choices that we face?
-
What laws provide worker benefits?
-
What coverage is given by fire, marine, homeowners, renters, and flood insurance?
-
Five people (Antoine, Bart, Carina, Duncan, and Emily) form a club, N=(A, B, C, D, E). Carina and Emily are women, and the others are men. If they choose a marshall randomly, find the odds against a...
-
For the following arrangements, discuss whether they are 'in substance' lease transactions, and thus fall under the ambit of IAS 17.
-
In an attempt to measure the emotional effect of a proposed billboard ad, an advertising agency checks the pulse rate of 10 persons before and after they are shown a photograph of the billboard. The...
-
The following data show residential and commercial natural gas consumption (quadrillion Btu) from 1992 through 2007. a. Construct a graph of the time series, then superimpose a three-year centered...
-
Repeat Exercise 17.9, but for a third-order model and using y = top speed (mph) as the dependent variable. During the 1960s, manufacturers of the so-called muscle cars were accused of deliberately...
-
Consider a Poisson regression. Let \(e_{i}=y_{i}-\widehat{\mu}_{i}\) denote the \(i\) th ordinary residual. Assume that an intercept is used in the model so that one of the explanatory variables...
-
a. Assume that \(y_{1}, \ldots, y_{n}\) are i.i.d. with a negative binomial distribution with parameters \(r\) and \(p\). Determine the maximum likelihood estimators. b. Use the sampling mechanism in...
-
For the data in Table 12.1, confirm that the Pearson statistic in equation (12.3) is 41.98 . Table 12.1 (12.3) Count Observed (j) (nj) Fitted Counts Using the Poisson Distribution (np;) 01234 6,996...

Study smarter with the SolutionInn App