

Question: In a current study, a random sample of 20 teachers from Utah and an independent random sample of 20 teachers from Oregon have been asked
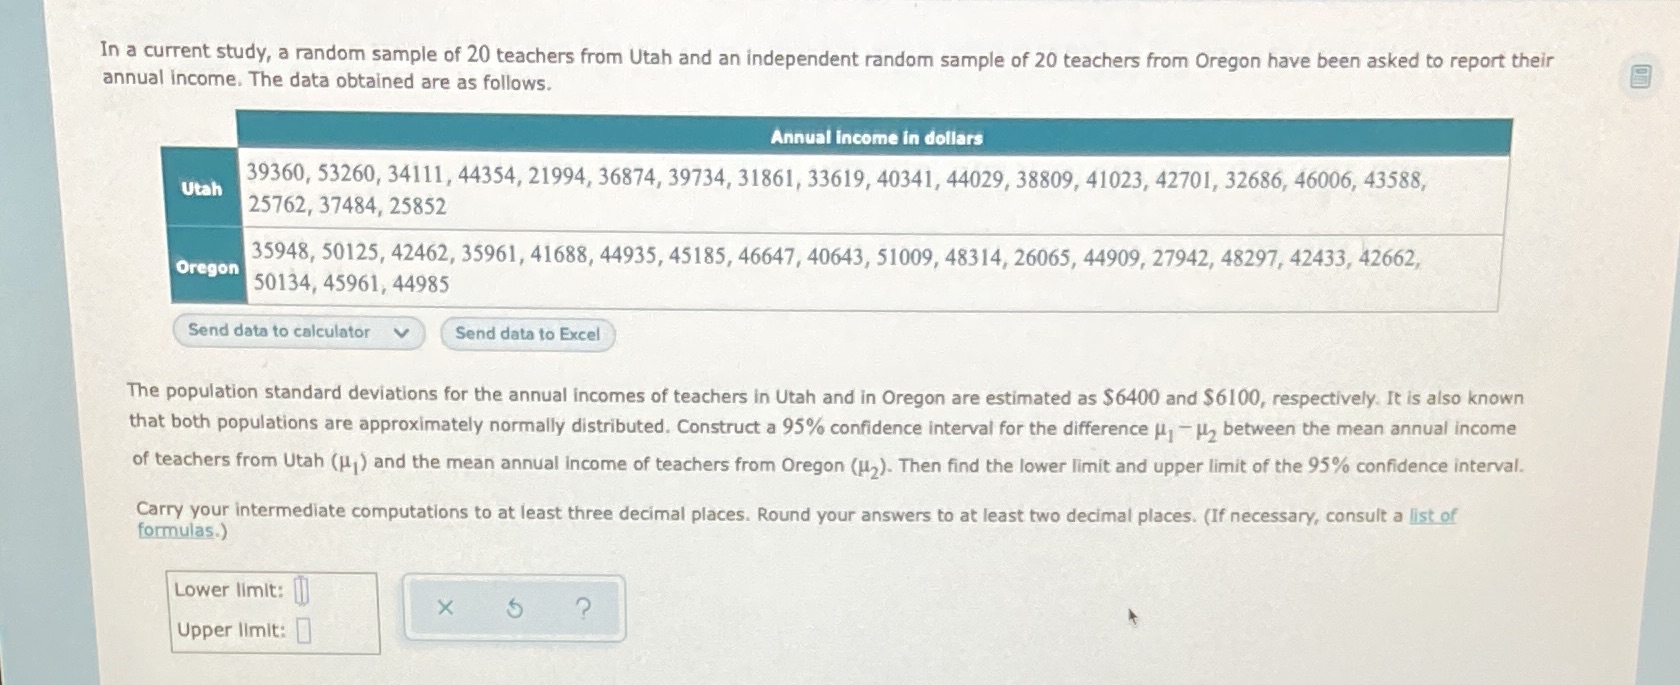
In a current study, a random sample of 20 teachers from Utah and an independent random sample of 20 teachers from Oregon have been asked to report their annual income. The data obtained are as follows. Annual income in dollars 39360, 53260, 34111, 44354, 21994, 36874, 39734, 31861, 33619, 40341, 44029, 38809, 41023, 42701, 32686, 46006, 43588, Utah 25762, 37484, 25852 35948, 50125, 42462, 35961, 41688, 44935, 45185, 46647, 40643, 51009, 48314, 26065, 44909, 27942, 48297, 42433, 42662, Oregon 50134, 45961, 44985 Send data to calculator Send data to Excel The population standard deviations for the annual incomes of teachers in Utah and in Oregon are estimated as $6400 and $6100, respectively. It is also known that both populations are approximately normally distributed. Construct a 95% confidence interval for the difference , - Wy between the mean annual income of teachers from Utah (J ) and the mean annual income of teachers from Oregon (H,). Then find the lower limit and upper limit of the 95% confidence interval. Carry your intermediate computations to at least three decimal places. Round your answers to at least two decimal places. (If necessary, consult a list of formulas.) Lower limit: X Upper limit
Step by Step Solution
There are 3 Steps involved in it

Get step-by-step solutions from verified subject matter experts