

Question: In a matlab code please 1. The approximate population of the world for selected years from 1850 until 2010 is given below: Year1850 1910 1950
In a matlab code please 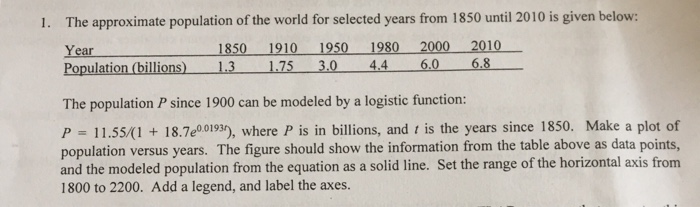
1. The approximate population of the world for selected years from 1850 until 2010 is given below: Year1850 1910 1950 1980 2000 2010 Population (billions) 13 1.75 3.0 44 6.0 6.8 The population P since 1900 can be modeled by a logistic function: P 11.55(1 18.7e00193), where P is in billions, and t is the years since 1850. Make a plot of population versus years. The figure should show the information from the table above as data points, and the modeled population from the equation as a solid line. Set the range of the horizontal axis from 1800 to 2200. Add a legend, and label the axes
Step by Step Solution
There are 3 Steps involved in it
1 Expert Approved Answer
Step: 1 Unlock

Question Has Been Solved by an Expert!
Get step-by-step solutions from verified subject matter experts
Step: 2 Unlock
Step: 3 Unlock