

Question: In a statistics class, students took their pulses before and after being frightened. The frightening event was having the teacher scream and run from one
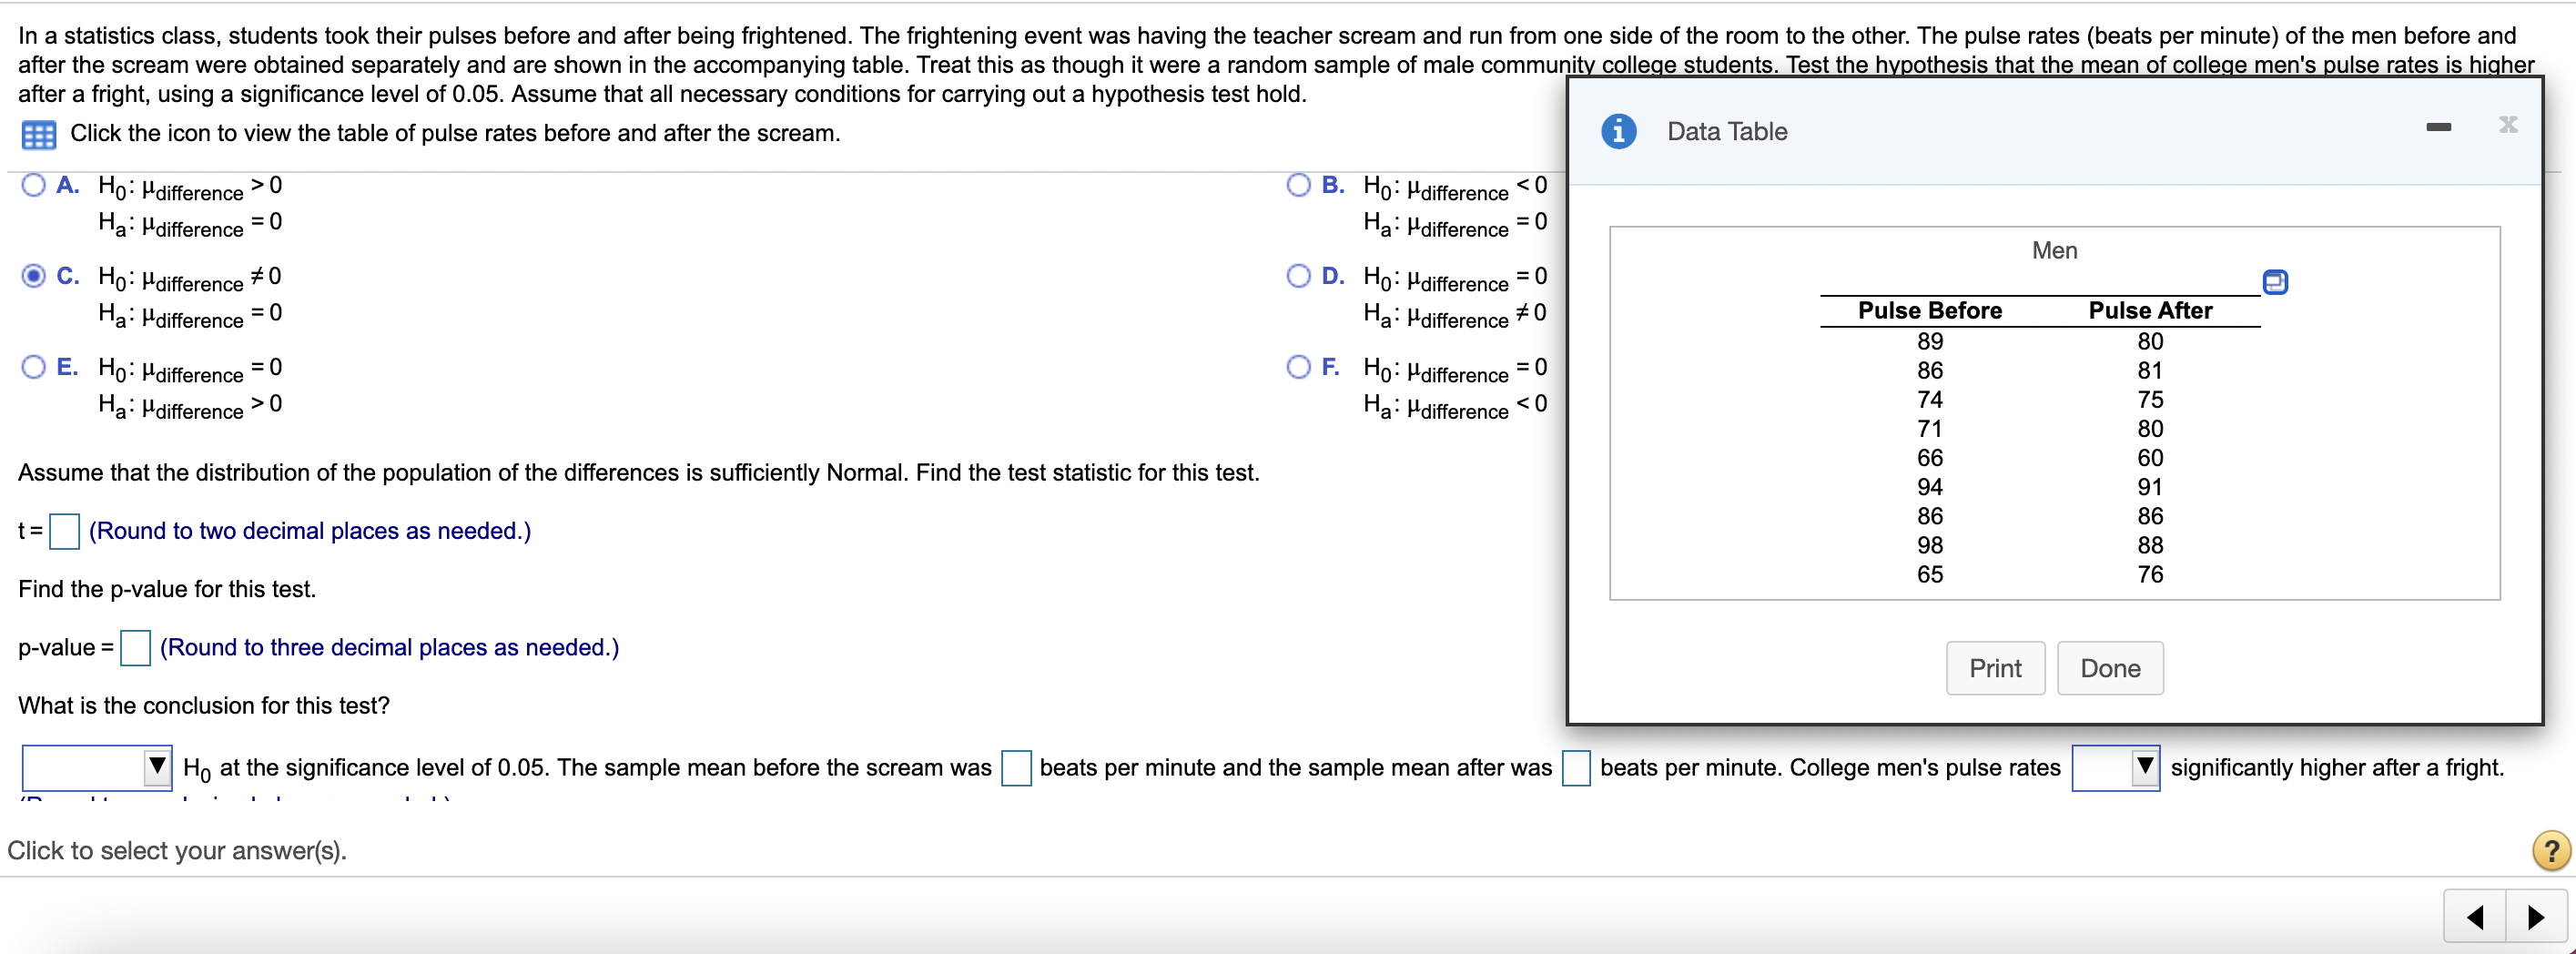
In a statistics class, students took their pulses before and after being frightened. The frightening event was having the teacher scream and run from one side of the room to the other. The pulse rates (beats per minute) of the men before and after the scream were obtained separately and are shown in the accompanying table. Treat this as though it were a random sample of male oommuni collee students. Test the h -othesis that the mean of collee men's -ulse rates is hiher after a fright, using a signicance level of 0.05. Assume that all necessary conditions for carrying out a hypothesis test hold. g Click the icon to view the table of pulse rates before and aer the scream. 0 Data Table 707A- \"01 \"difference > 0 O 3- Ho: \"difference 0 Ha: \"difference l
Step by Step Solution
There are 3 Steps involved in it

Get step-by-step solutions from verified subject matter experts